

Drawn from the thesis of Francesca Nadalini (trainee at GO-Mobility)
Decoding the rhythm of cities with GPS data
A study on the potential of activity-based models
How well can we understand the movements of a city? Here are 5 things we learned from the thesis research of our trainee Francesca Nadalini (Politecnico di Milano), a valuable study aimed at identifying new data sources and developing innovative methods to fuel activity-based models (AcBM) and produce useful metrics to guide mobility planning. Based on an extensive sample of GPS traces, we will discover how it is possible to transform raw and chaotic data into a detailed narrative of human behavior and develop solutions for current mobility challenges.
From how we travel… to why
The thesis focuses on the potential of activity-based models, which shift the transport planner’s question by focusing not so much on the trip itself but on why it is made, that is, on the activities that drive people to move. Why is this paradigm shift so important? We explained it in just 7 minutes in this illustrated video 👇
The limitation of traditional transport models, known as trip-based, is that they consider each trip as an isolated event from point A to point B, without taking into account the complex chains of decisions that characterize people’s lives.
However, people do not travel for the simple sake of it (or at least not always), but do so because they are driven by different needs and activities (work, study, shopping, leisure) distributed differently in time and space. It is the concept of derived demand: the trip is a consequence, not the ultimate goal.

An example: imagine a person (“Anna”) who is used to going to work by car leaving at 7:30 and stopping to shop at the supermarket on the return trip home. One day her company decides to offer its employees a strong monetary incentive for using public transport. At that point Anna decides it is more convenient to go to work by train. She will therefore reorganize her routine: she will decide to reach the station on foot to get some daily exercise, and since the old supermarket is no longer so convenient, she will choose a new reference for shopping, namely the market near home, which she will pass on the way back from the station. Here: a traditional model would not be able to predict such a complex reorganization, while an activity-based approach would be able to do so because it considers the individual’s needs.

Image inspired by the example reported in the study by Ben-Akiva and Bowman in “Activity Based Travel Demand Model Systems[1]]
Activity-based models, in fact, represent a paradigm shift: they place the person, not the trip, at the center of the analysis, considering their entire daily activity schedule. These models do not merely study how we move, but seek to simulate why, when, and how we organize our day.
This approach offers a much more realistic vision and allows testing with greater accuracy the introduction of any changes to the routine, whether monetary incentives as in Bob’s example up to new regulations on smart working or urban tolls.
“Stated simply, the motivation for activity-based travel demand modelling is that travel decisions are activity based.”
From sample surveys to GPS data
For decades, the main source of data for transport planning has been travel surveys conducted in the form of sample questionnaires. This method, while valuable, has significant limitations: it is extremely costly, time-consuming, and subject to memory errors or inaccuracies by respondents (a phenomenon known as “recall bias”).
The breakthrough in the transport field is represented by the advent of GPS data, provided by providers that collect data from apps, appropriately anonymized to ensure user privacy. These data offer great advantages for those who study and plan mobility: precision, objectivity, efficiency, and, above all, unprecedented scale. In the case of the research in question, which used the city of Milan as its focus, it is a database of 100 million GPS “pings” and almost one million users, considering an observation period of one month (mid-November to mid-December 2024).
However, these are not ready-to-use data. Like many big data that are not specifically created for mobility analyses (“first generation big data“, we discussed this here), they are presented in raw form and require an accurate cleaning process to ensure quality and completeness. First, all profiles that had an insufficient and very sparse number of pings during the observation month were removed, losing 82% of the sample. On the remaining 164,000 profiles, further cleaning steps were carried out to obtain mobility diaries that were as reliable and reconstructable as possible, for example discarding those who had data available for less than three days and arriving at a final core of 17,000 mobility diaries.
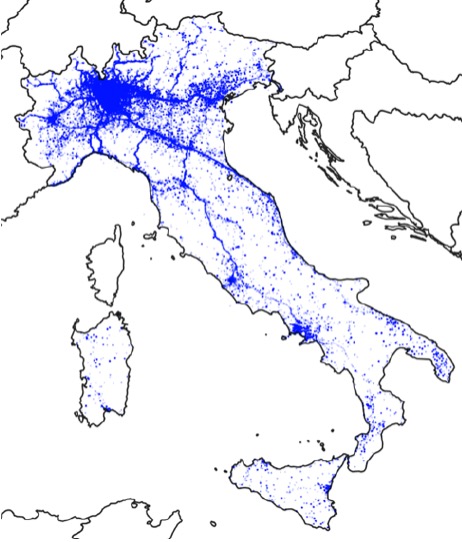
Raw data: distribution of pings (Milan case study)
Reconstructing behaviors
The second methodological step was to recognize, from a chaotic sequence of GPS points, which of these were the trajectory of a movement (trip) and which instead represented stationing in a place for carrying out an activity (stop).
Traditional methods, based on fixed thresholds of time or speed, are not suitable for this type of data: the frequency of GPS pings is too variable and inconsistent. The study therefore adopted DBSCAN (Density-Based Spatial Clustering of Applications with Noise), an unsupervised clustering algorithm (we discussed supervised models here), applying it in an innovative way. Instead of simply grouping geographic points, the methodology applied the algorithm to coordinates weighted by speed between one point and the next.
Thanks to this adjustment, points belonging to a trip (high speed, scattered points) were grouped into clusters, while points of a stop (almost zero speed, densely accumulated points) were classified by the algorithm as anomalous (“noise”). The innovation consisted in understanding that, in this context, the anomaly was not an error to be discarded, but exactly the signal being sought: the activity. To correct small inaccuracies and refine the distinction between stops and trips, other minor post-processing steps were carried out, including techniques such as K-Nearest Neighbors (KNN), which added an additional level of methodological robustness.
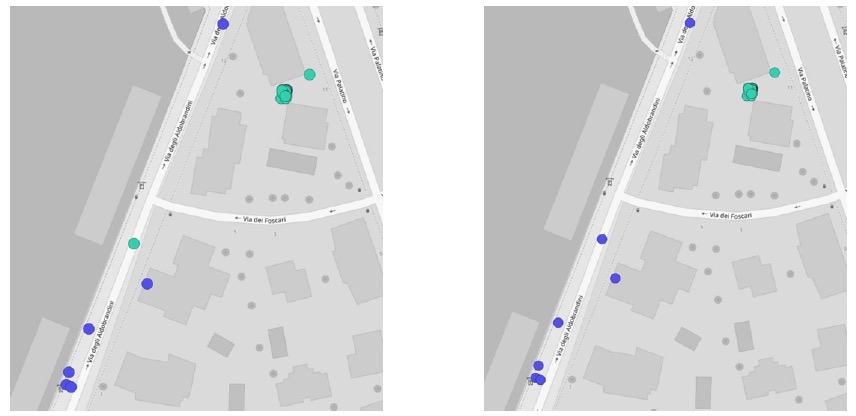
Identification of stop points (green) and movement points (blue) and correction with elimination of isolated stop points (on the right)
Identifying trip purposes
To take the final step toward the core of activity-based models, namely knowing the purpose of the trip, it is necessary to know the nature of the destination: is it an office, a shop, a school?
The classification of destinations consists of two levels:
- a first “macro” level in which activities are distinguished into three main categories: Home, Main Activity, and Secondary Activity, according to precise time and frequency parameters.
- a second level in which, thanks to the integration of land use data, detail is entered to give a more precise classification to these macro-categories (for example, whether the main activity is study or work, or what type of secondary activity it is) and to correct any anomalies.
To do this, activity data were overlaid with land use information from OpenStreetMap (OSM). A catchment area was created that covered 98% of identified activities, processing approximately 1.2 million buildings and 224,000 Points of Interest (POI). By overlaying the position of each stop with these maps, it was possible to deduce the purpose: for example, if a long-duration stop fell on an area mapped as “university,” the activity was classified as “Study“; if it fell on an area with offices, it became “Work“.
However, it is important to emphasize the importance of the first step, that of recognizing activities into macro-categories: land use data, in fact, are not always precise and have gaps. In other cases, it is difficult to understand whether the ping refers to one shop or the one next to it. Without accurate categorization of usual residence and main activity, for example, it would not be possible to understand whether a person going to a restaurant is doing so to have lunch (secondary activity) or for work (main activity).
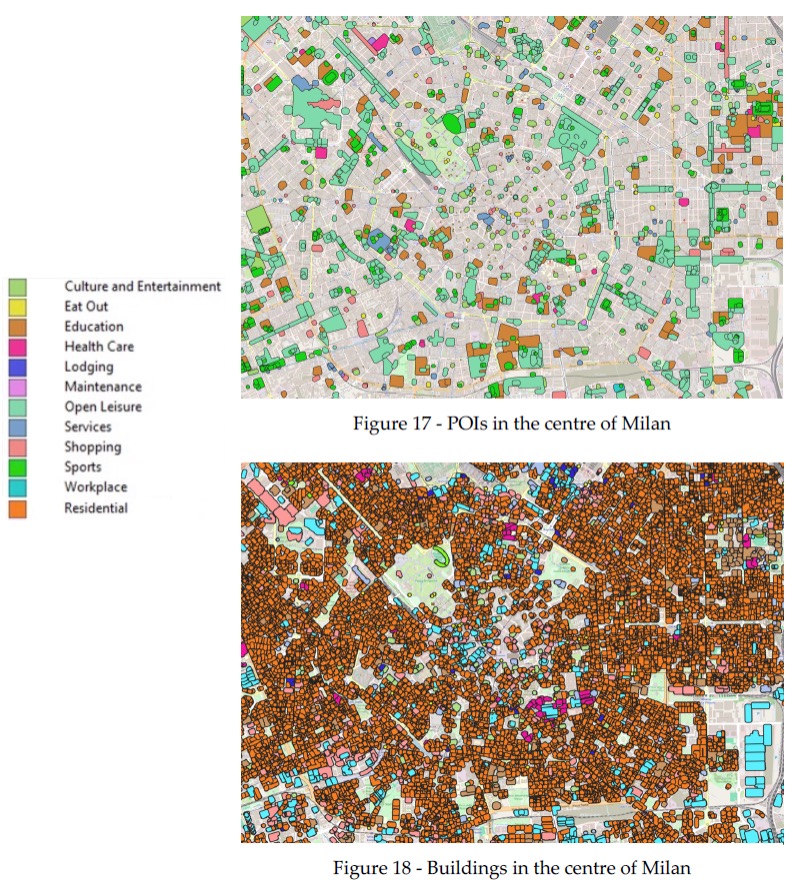
Image from the thesis
Not only that: the methodology included a two-way adjustment process. For example, an activity initially classified as “Occasional” (because infrequent), but lasting many hours in an area mapped as “Workplace,” was corrected to “Work.” Conversely, an activity classified as “Regular” (because daily), but very brief, such as stopping at the bar for morning coffee, was reclassified as “Occasional.” This procedure made it possible to translate a set of scattered coordinates into a series of activities with a purpose, getting closer and closer to the research goal: decoding human behavior.
No more “average travelers”: seeing and recognizing different user profiles
Contemporary mobility behaviors follow increasingly multifaceted and complex logics, often linked to people’s different life trajectories and contexts. Consequently, to create effective mobility models, the population cannot be treated as a homogeneous block. It is necessary to identify segments with similar behaviors, the so-called “person types.” How was this possible?
The different mobility profiles were extrapolated by analyzing recurring activity patterns. For example:
- A user with long and recurring stops in places labeled as “Workplace” was classified as “Full-time worker” (or “part-time” if the average duration was below a certain threshold).
- A user whose main stops occurred in “Education” places was identified as “University student” or “Secondary school student,” depending on the type of institution.
- Users who did not show regular patterns of “mandatory” activities were classified in the “Non-worker/retiree” group.
However, as the thesis points out, this method cannot distinguish with certainty a “non-worker” from a “retiree,” given the absence of demographic data. Similarly, it struggles to identify students’ part-time jobs, since the study activity is dominant. These are limitations that could be compensated by integrating other types of data more traditional (data fusion), for example census data or data from questionnaires.
Recognizing these limitations demonstrates, however, how, even from anonymous data, it is still worth exploiting the enormous potential of GPS data for the volume of movements identifiable simultaneously at an unprecedented level of detail and the absence of recall bias, reconstructing population segments with distinct behaviors and providing important elements for understanding and improving the mobility of our cities.
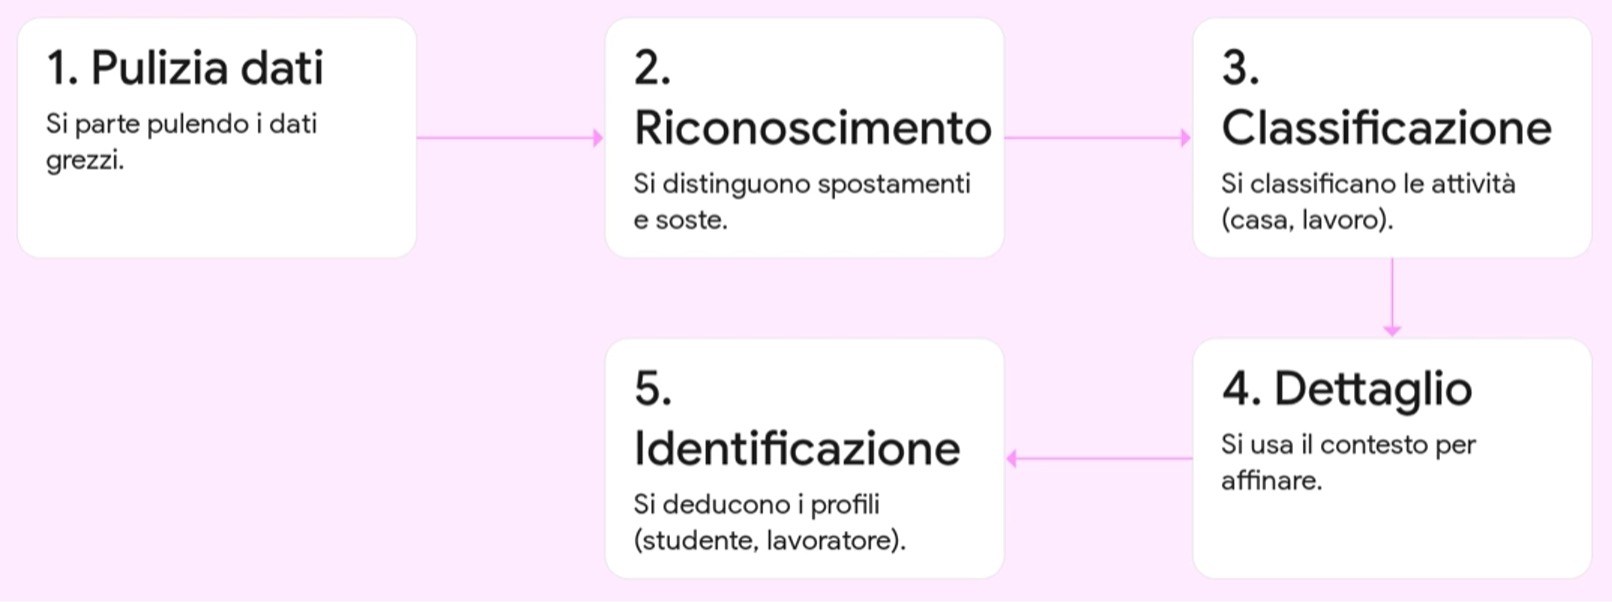
Beyond a Mere Academic Exercise
The research demonstrates that combining large-scale GPS data with advanced analytical methodologies represents an extremely powerful tool for understanding urban mobility, with an unprecedented level of detail and accuracy.
However, to ensure this does not remain a mere academic exercise, it is important that these tools and methodologies increasingly permeate the toolkits of urban planning and territorial governance. This rich dataset and the proposed methodology, for example, can be used to power simulation platforms capable of creating a digital twin of the population under study, and thus of the city’s daily life (see our in-depth analysis here). The methodology is designed to be replicable in any city and territory, although transferability is partially linked to the quantity and quality of available data.
As mentioned, thanks to these tools we are able to test more realistically how the population would react to the introduction of new services, policies, or incentives, such as adding a new metro line, or to optimize public service schedules or plan cycling infrastructure in a targeted manner.
Improving the ability to analyze this data is essential for designing mobility services that are increasingly efficient and tailored to the inhabitants of our cities and their diverse needs.
[1] Ben-Akiva, M.E., Bowman, J.L. (1998). Activity Based Travel Demand Model Systems. In: Marcotte, P., Nguyen, S. (eds) Equilibrium and Advanced Transportation Modelling. Centre for Research on Transportation. Springer, Boston, MA. https://doi.org/10.1007/978-1-4615-5757-9_2
Would you like to receive monthly articles, news and special content selected for you?
Sign up for our Data Mobility newsletter
©2026 GO-Mobility s.r.l. | VAT Number 11257581006

