
GO-Mobility
Bologna Città 30: top or flop?
A data-driven analysis
It was July 2023 when the City of Bologna announced the introduction of ‘Città 30’, extending the 30 km/h speed limit to around 70% of urban roads and becoming the first major Italian city to adopt a measure of this scale. The debate over the measure’s effectiveness soon spread from the porticoes of the Emilian capital to the rest of the country, based mainly on first impressions and the limited data available.
But what do the figures say about the impact of ‘Città 30’ on Bologna? Two and a half years after the project was launched, and following the conclusion of the administrative proceedings surrounding the scheme, we are now able to provide more definitive answers to what have been (and still are) the most frequently asked questions: how much extra time is lost in traffic? Is Bologna a more polluted city? Are its roads really safer? In collaboration with the Municipality of Bologna and the IU Rusconi Ghigi Foundation, and thanks to big data from car black boxes, we have analysed over 4 million journeys within the urban area of Bologna and have compiled the answers to these various questions.
The different phases of Bologna Città 30
The history of the measure is not straightforward; on the contrary, since its inception it has undergone various stages and changes, resulting in it being implemented in several phases.
- In July 2023, the 30 km/h speed limit will be extended to the relevant roads through the installation of road signs alone. The measure has therefore been announced, but there are not yet any systematic checks in place.
- From January 2024, the traffic regulations will come into force and enforcement checks will begin. To coincide with the launch of the measure, from 16 January to 31 December 2024, the local police carried out 166 days of checks with road patrols (approximately one every two days), totalling 322 shifts, stopping and checking 193 vehicles and issuing 2,046 fines, of which 306 were for exceeding the speed limit. Checks are carried out by patrols (around 6 per day) and laser speed guns in all districts of the city, particularly on roads affected by the change from 50 to 30 km/h[1].
- On 20 January 2026, the Regional Administrative Court (TAR) of Emilia-Romagna upheld the appeal lodged by two taxi drivers and quashed the decision.
- On 20 April 2026, following the approval by the Bologna City Council of the new “Detailed Plan for Speed Management on Bologna’s Urban Roads”, the 30 km/h speed limit is reintroduced on 258 km of roads (the same roads covered by the previous measure) through the implementation of 22 by-laws which define, road by road – as required by the Ministry of Infrastructure and Transport and in compliance with the Regional Administrative Court’s ruling [2] – the individual 30 km/h zones spread across all neighbourhoods.
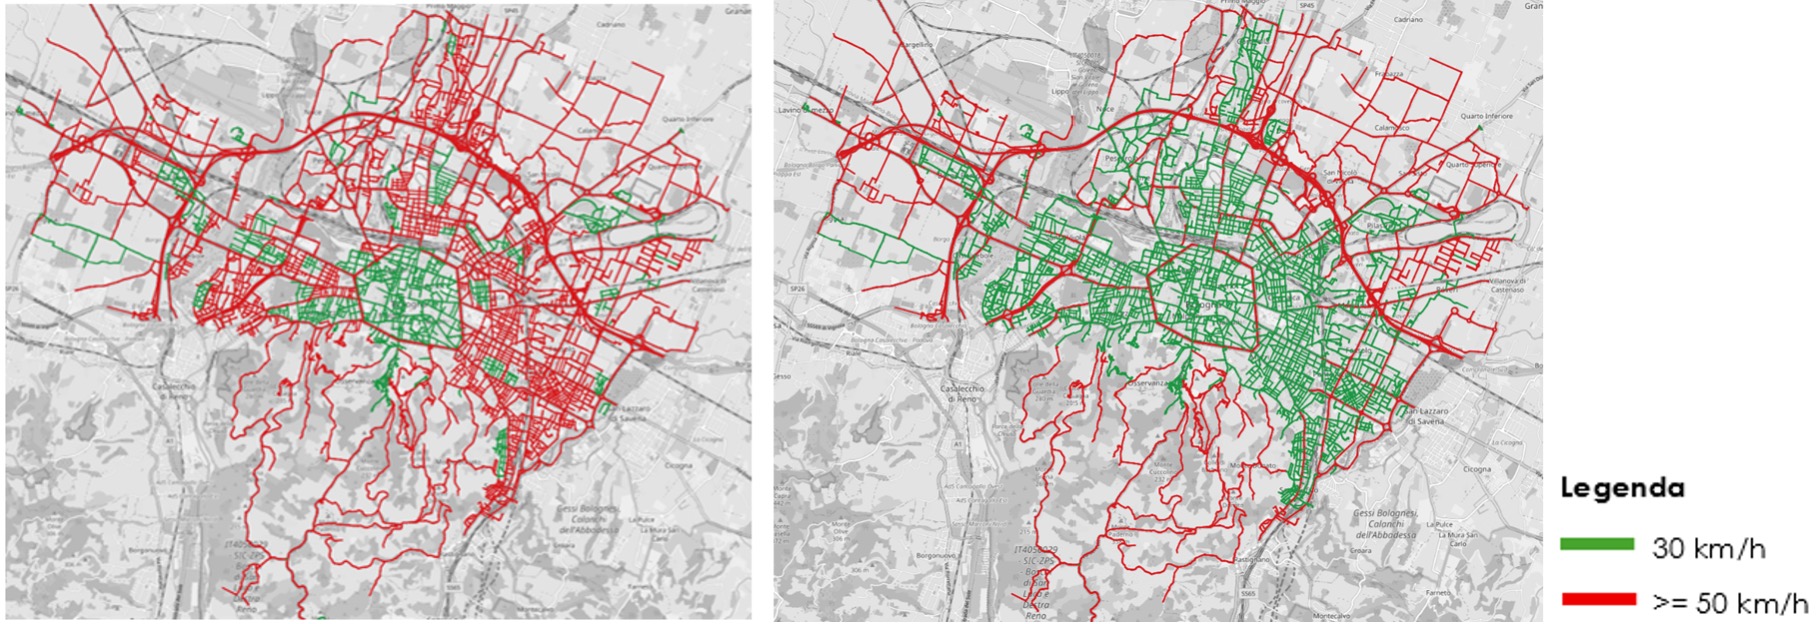
Figure 1 – Speed limits on Bologna’s road network before (left) and after (right) the implementation of the traffic regulations that came into force on 15 January 2024
The practical implementation of the measure, in addition to the enforcement of checks, involves a multi-year investment programme to give tangible form to the ‘Città 30’ scheme through physical improvements; the budget for this has risen from an initial €24 million to over €35 million, to improve the safety of roads, junctions and crossings, the creation of new pedestrian and school squares, and the expansion of the network of footpaths, cycle paths and cycle lanes, as well as cycle stations. From 2022, when the guidelines for Bologna Città 30 were approved, to the start of 2026, approximately €18.9 million worth of works have already been completed, €6.5 million are currently underway, €7.7 million are in the design phase and €2.1 million are yet to be planned.
In order to ‘isolate’ as far as possible the effects of the introduction of the Città 30 scheme on the city, various pre- and post-ordinance periods were compared, taking into account both the first six months of 2023 (when the installation of signage announcing the implementation of the measure had not yet begun), the phase of signage installation (October 2023) and, finally, the actual implementation of the by-law in the subsequent periods (the first six months of 2024 and 2025), accompanied by enforcement checks and the commencement of infrastructure works.
What we measured and how
The analysis covers the main, primary, secondary and local roads in Bologna and is based on two separate FCD databases, both derived from black boxes installed in vehicles for insurance purposes, which have been integrated to enhance the study as it progresses:
- Aggregated FCD data (2023–2025): over 4 million journeys analysed, spread across twelve sample weeks (Q1 and Q2) for each year. This data covers speed, journey times and critical events, namely sudden changes in acceleration (so-called ‘harsh’ events) and collisions (‘crashes’).
- High-frequency FCD data from October 2023 and October 2024, corresponding respectively to the periods closely linked to the phase involving the introduction of signage alone and the phase characterised by enforcement checks. A smaller but very high-resolution sample, with GPS tracking at one-second intervals and high spatial accuracy, from which it is possible to obtain a detailed description of accelerations and decelerations, and thus of actual driving dynamics, with over 135,000 total journeys analysed and more than 90 million sampling points. This database was used to calculate, as accurately as possible, the emission levels generated by vehicles and for an in-depth analysis of sudden braking.
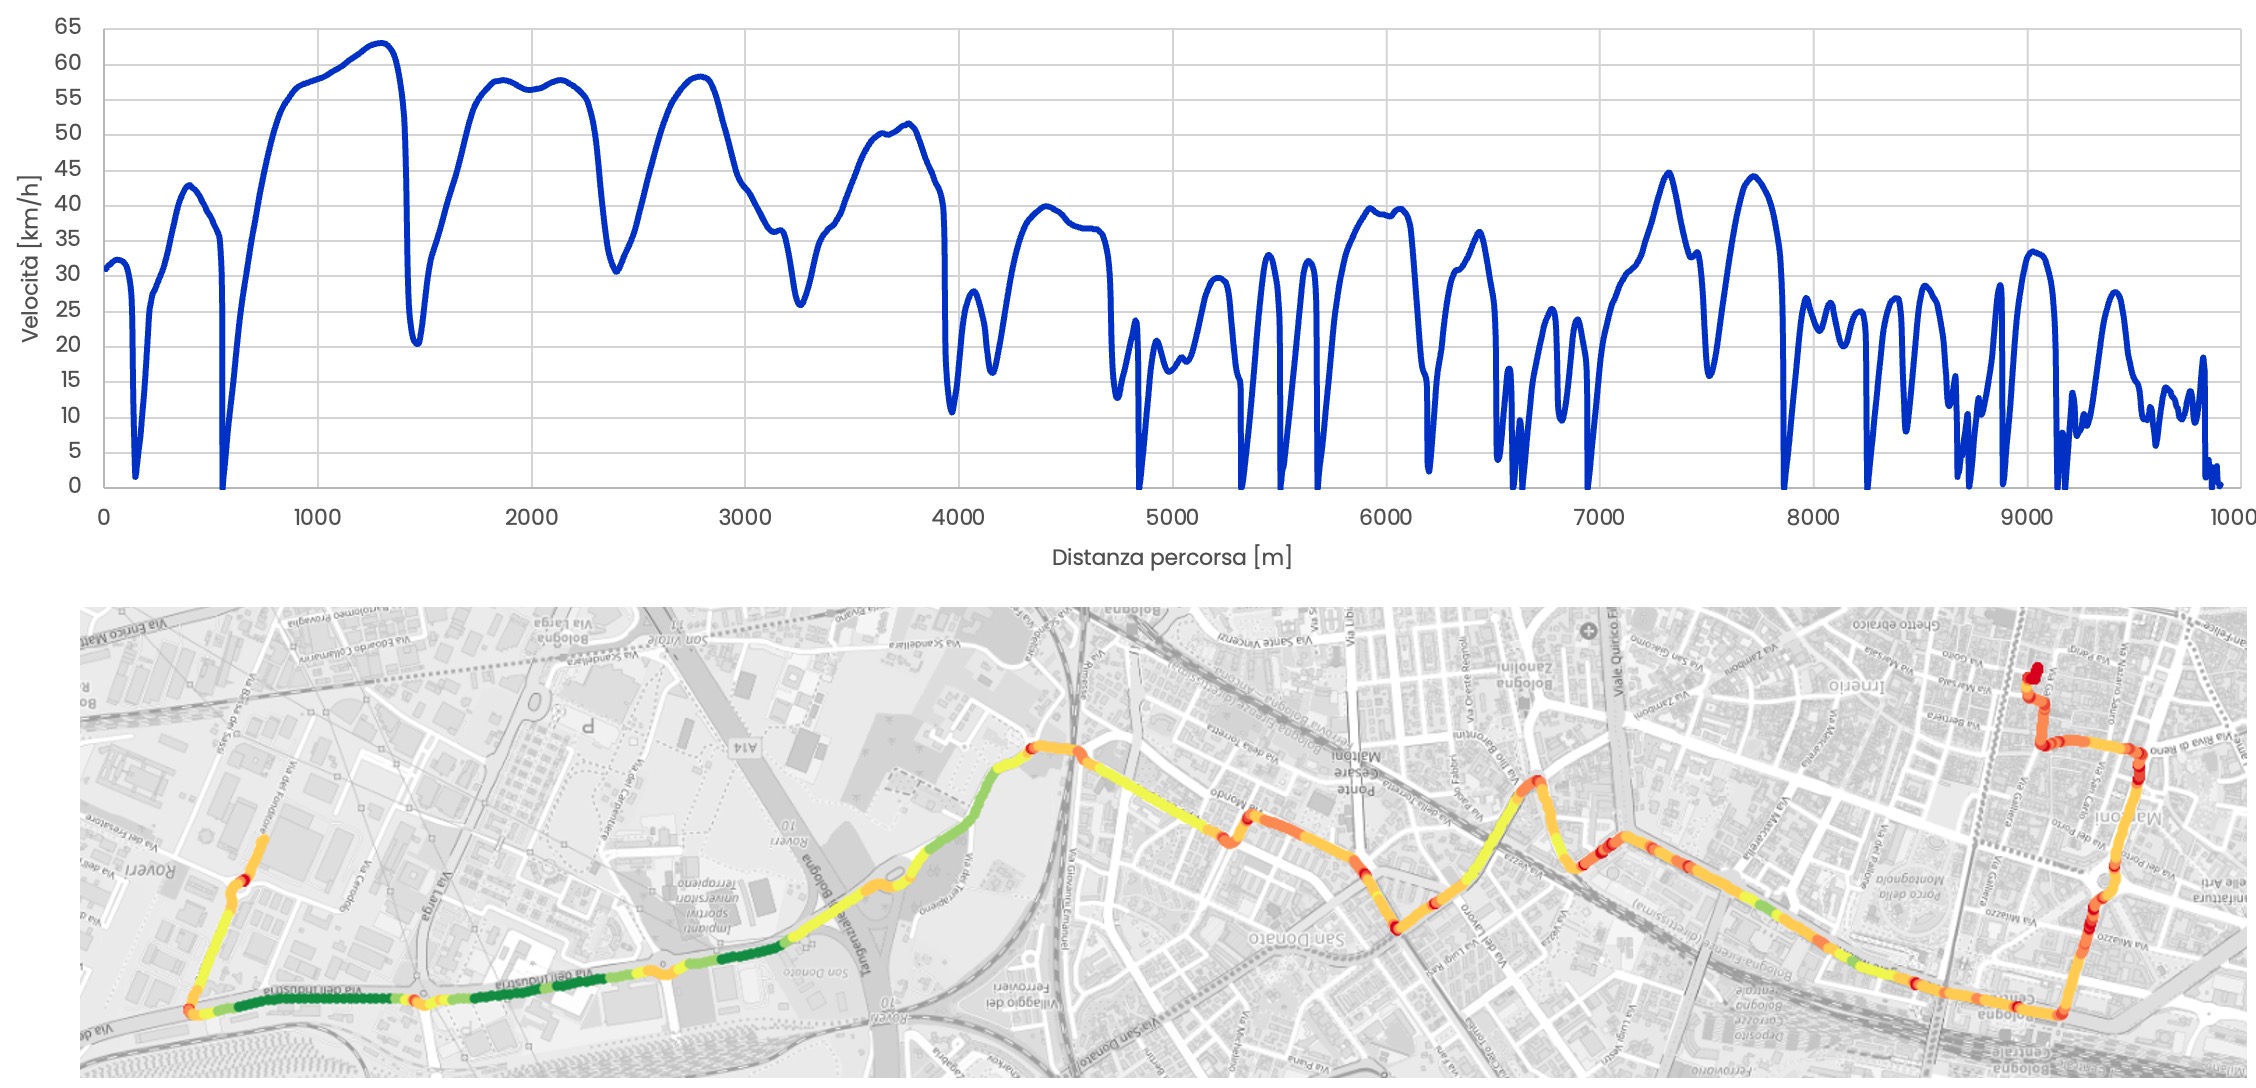 Figure 2 – Example trajectory derived from high-frequency FCD data: the top graph illustrates changes in speed (Y-axis) along the route (X-axis), whilst the map below pinpoints critical points, highlighting slowdowns using warm colours (green = higher speeds; red = lower speeds)
FCD data is processed in a fully anonymised and aggregated form, in compliance with European data protection regulations. The stratification of the high-frequency FCD sample[3] was validated by comparing the characteristics of the monitored vehicles with those of the regional vehicle fleet (source: ACI). As expected, the age distribution of the car fleet is slightly younger than that of the registered fleet (which includes all vehicles that are rarely used – as discussed here and as Istat also explains here), whilst the fuel type and brand are in line (see figure below).
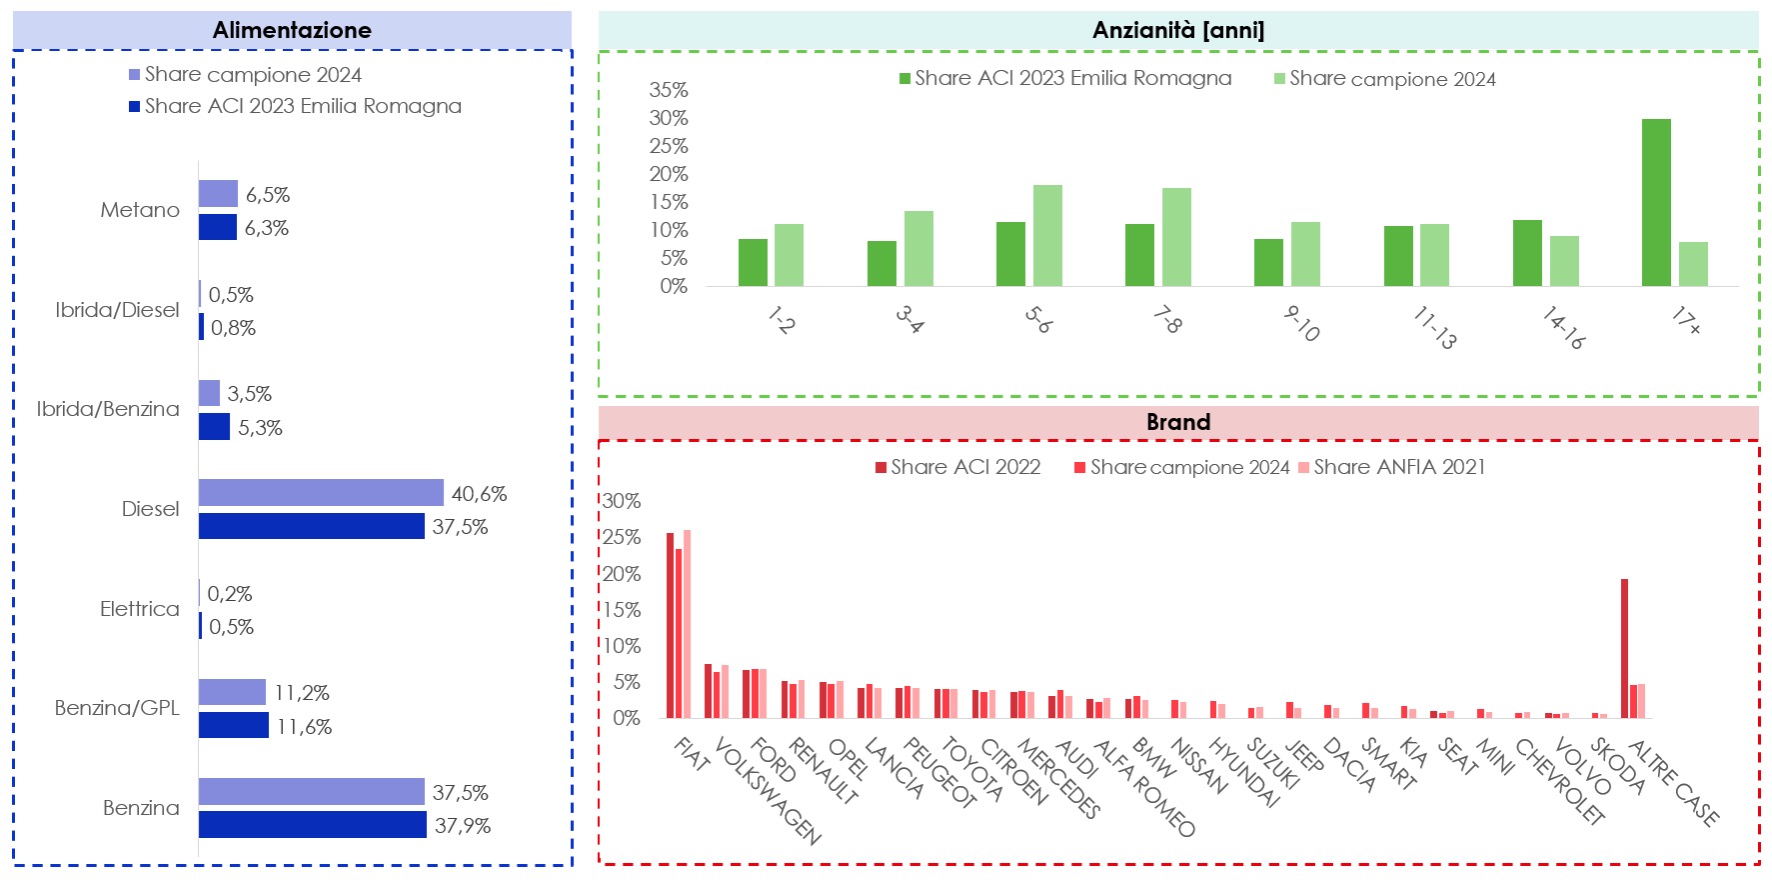
Figure 3 – Comparison of high-frequency FCD data and the ACI vehicle fleet
To estimate emissions in the urban area of Bologna, a model developed by GO-Mobility based on COPERT Tier 3 (Computer Programme to Calculate Emissions from Road Transport, version 5.8.1[4]) was used. COPERT is one of the main models for estimating emissions and is developed under the coordination of the European Environment Agency for use by Member States in compiling national emissions inventories. The model provides up-to-date emission factors by vehicle type, fuel type and Euro emission class and was fed with information from high-frequency FCDs, in accordance with the methodological approach set out in the Air Pollutant Emission Inventory Guidebook[5]. The emissions model developed by GO-Mobility exploits the high resolution of FCD data to reproduce the driving dynamics of each vehicle, including real-world acceleration and deceleration: a level of precision that is difficult to achieve with traditional methodologies.
How has compliance with the limits changed?
A comparison of the periods corresponding to the start of the measure (October 2023, with signage only) and the enforcement of checks (October 2024) reveals a slight but noticeable improvement in compliance with the speed limit. Whilst in October 2023 – i.e. with only road signs in place – 53% of journeys were within the speed limit, the following year this figure rose to 58%, representing an improvement (almost 6 in 10 drivers now comply with the limit) even without the application of ‘draconian’ measures. This figure is comparable to other cities that have recently introduced the ‘Città 30’ scheme, such as Amsterdam, where 63% of drivers comply with the new limit.
How much extra time is lost?
This is one of the most pressing concerns for those who drive every day and feel ‘targeted’ by the measure. But how much extra time is actually lost in Bologna as a result of the measure?
Looking at the comparison between pre- and post-measurement figures, again based on aggregated FCD data, it is clear that the median journey time across the entire urban network rose from 3 minutes 32 seconds per kilometre in 2023 to 3 minutes 53 seconds (+9.4%) in 2024 and 3 minutes 58 seconds in 2025 (+2.6%). For typical journeys made by an average user, this represents an increase of just over a minute per journey from 2023 to 2025 (+14 seconds per km on journeys of an average length of 5.2 km).
But how can we determine whether, and to what extent, this impact is attributable to the measure? To do this, we analysed the impact on journey times separately for the roads affected by the measure (where the speed limit was reduced from 50 to 30 km/h) and those that remained at 50 km/h, with a further focus on 10 sample routes typically travelled by an average user in the city (mixed roads subject to both 30 and 50 km/h limits, see Figure 5).
I dati mostrano che le variazioni sono molto simili in tutte le categorie: l’aumento è più marcato il primo anno (21 secondi per km, +9,4% nell’intera rete urbana nel 2024), per poi stabilizzarsi il secondo (+6 secondi per km, +2,6% nel 2025). Ma se si guarda alle sole strade interessate dal provvedimento di riduzione del limite a 30 km/h, si nota che i tempi di viaggio dal 2023 al 2025 in realtà aumentano in misura minore (di 24 secondi per km, +10,9%) rispetto a quelli delle strade rimaste a 50 km/h, che vedono l’impatto maggiore (+28 secondi per km, +14,8%), specialmente il secondo anno (+7 secondi/km), dove invece i tempi delle strade della Città 30 subiscono una variazione minima (+1 secondi/km) e gli itinerari-tipo vedono addirittura un lieve miglioramento dei tempi di viaggio (-1 secondi/km).
This shows that the increase in journey times across the entire urban network is largely attributable to external factors (including construction sites for new tram lines, Figure 6), whilst the roads affected by the measure experienced less significant delays, as did the typical routes taken by an average user, which were least affected (+14 seconds per km, i.e. from 3’04’’ to 3’18’’: +7.6%).
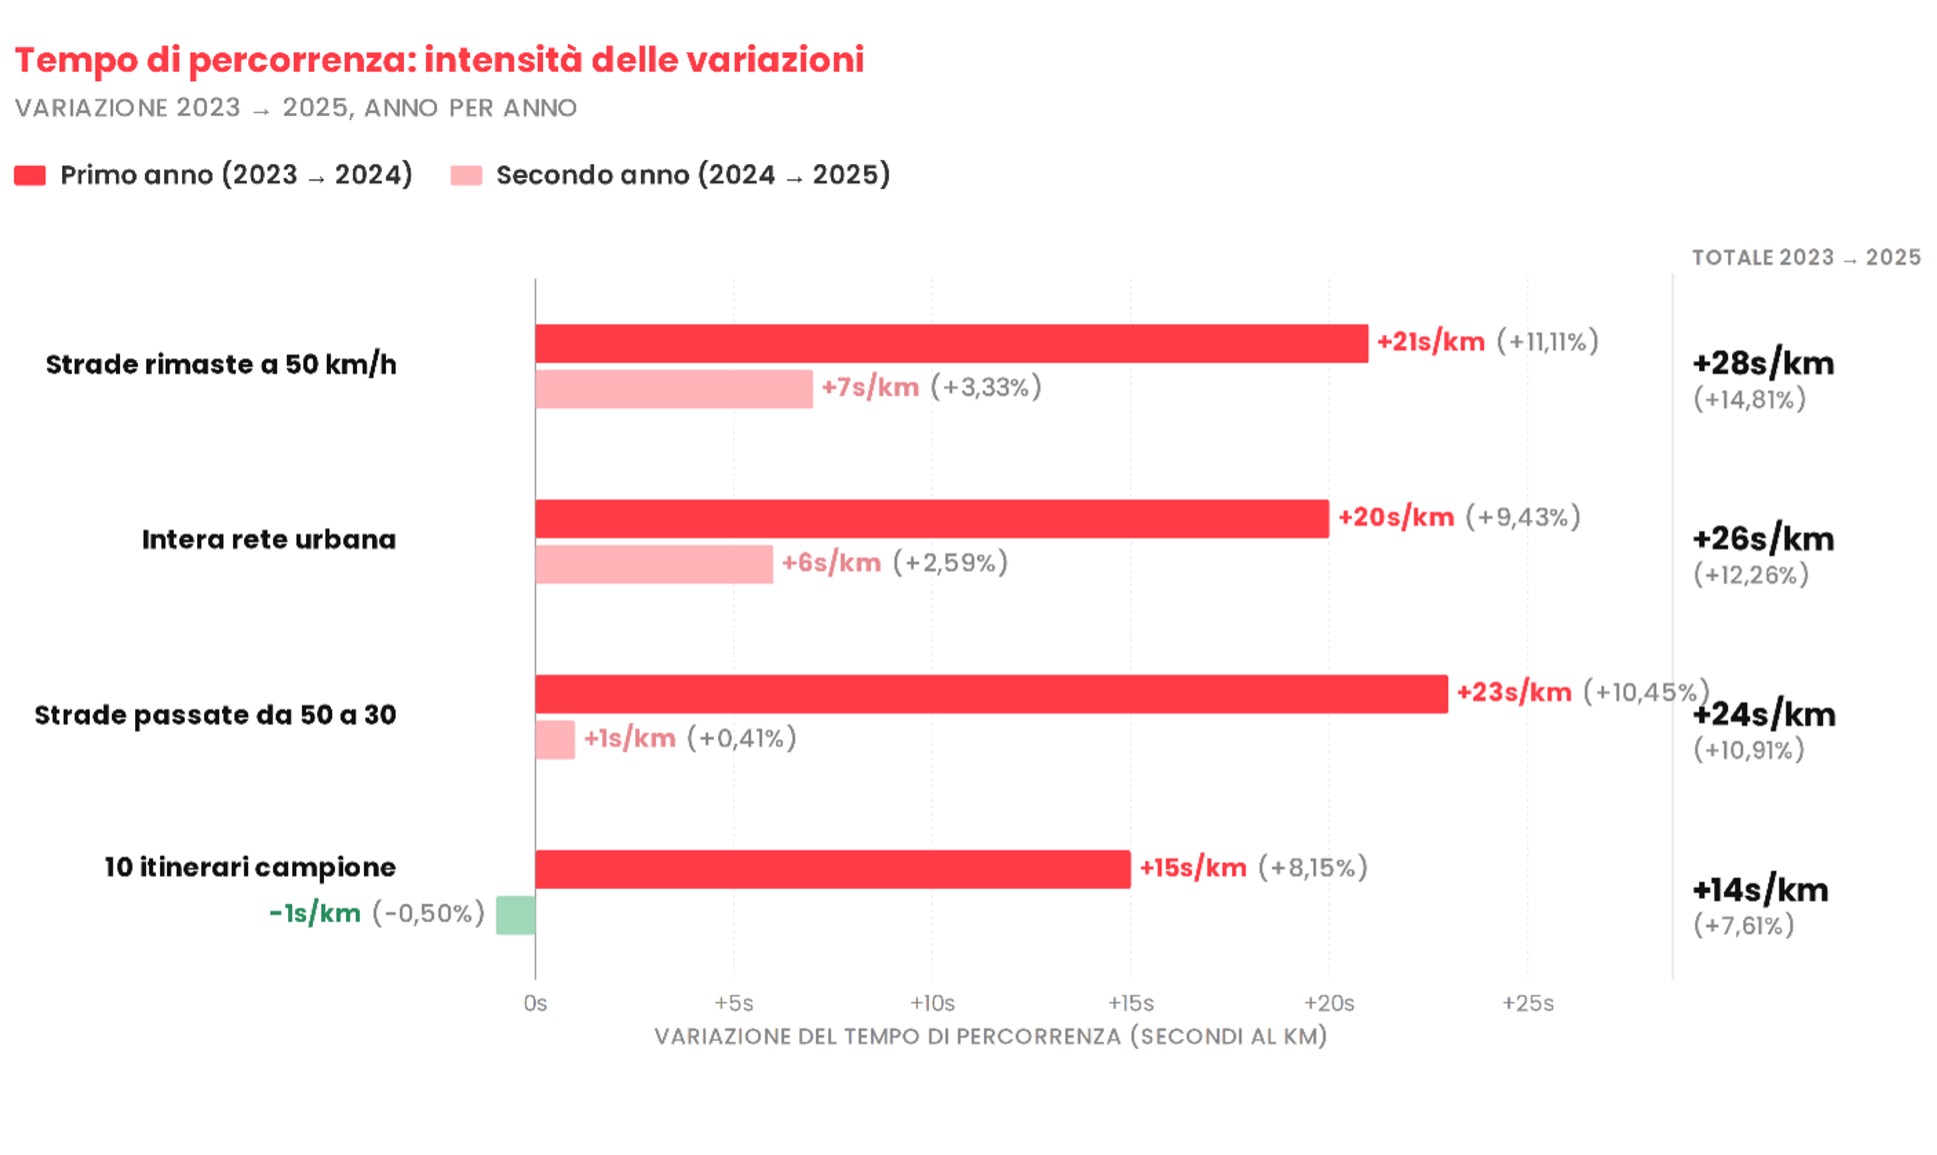 Figure 4 – Illustration of changes in journey times on different types of roads within Bologna’s urban network between 2023 and 2025, based on aggregated FCD data
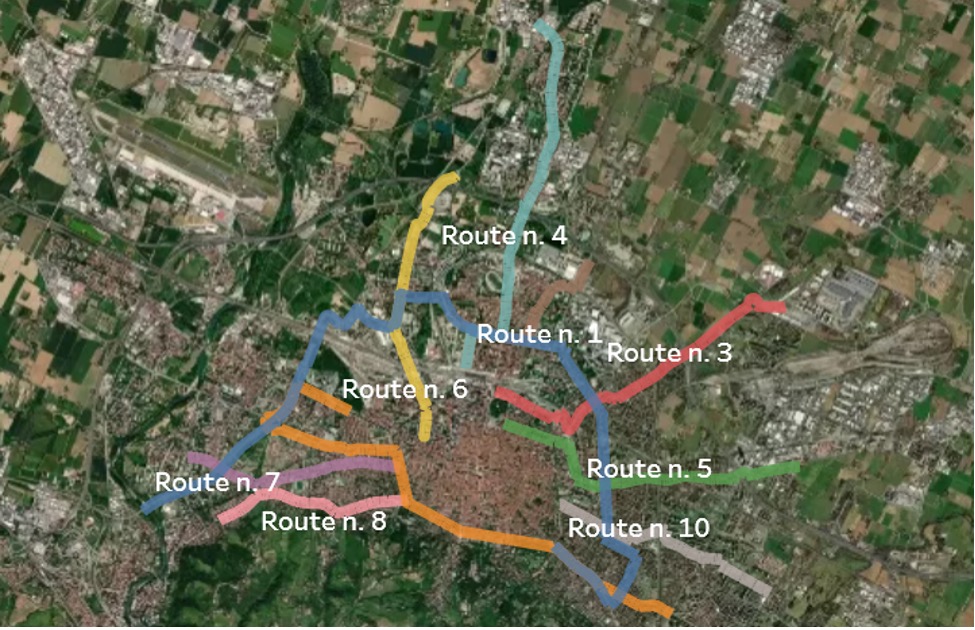
Figure 5 – The set of sample routes used to calculate the change in journey times on a number of typical routes taken by the average user, comprising both roads affected by the ‘Città 30’ project and others where speed limits remain unchanged
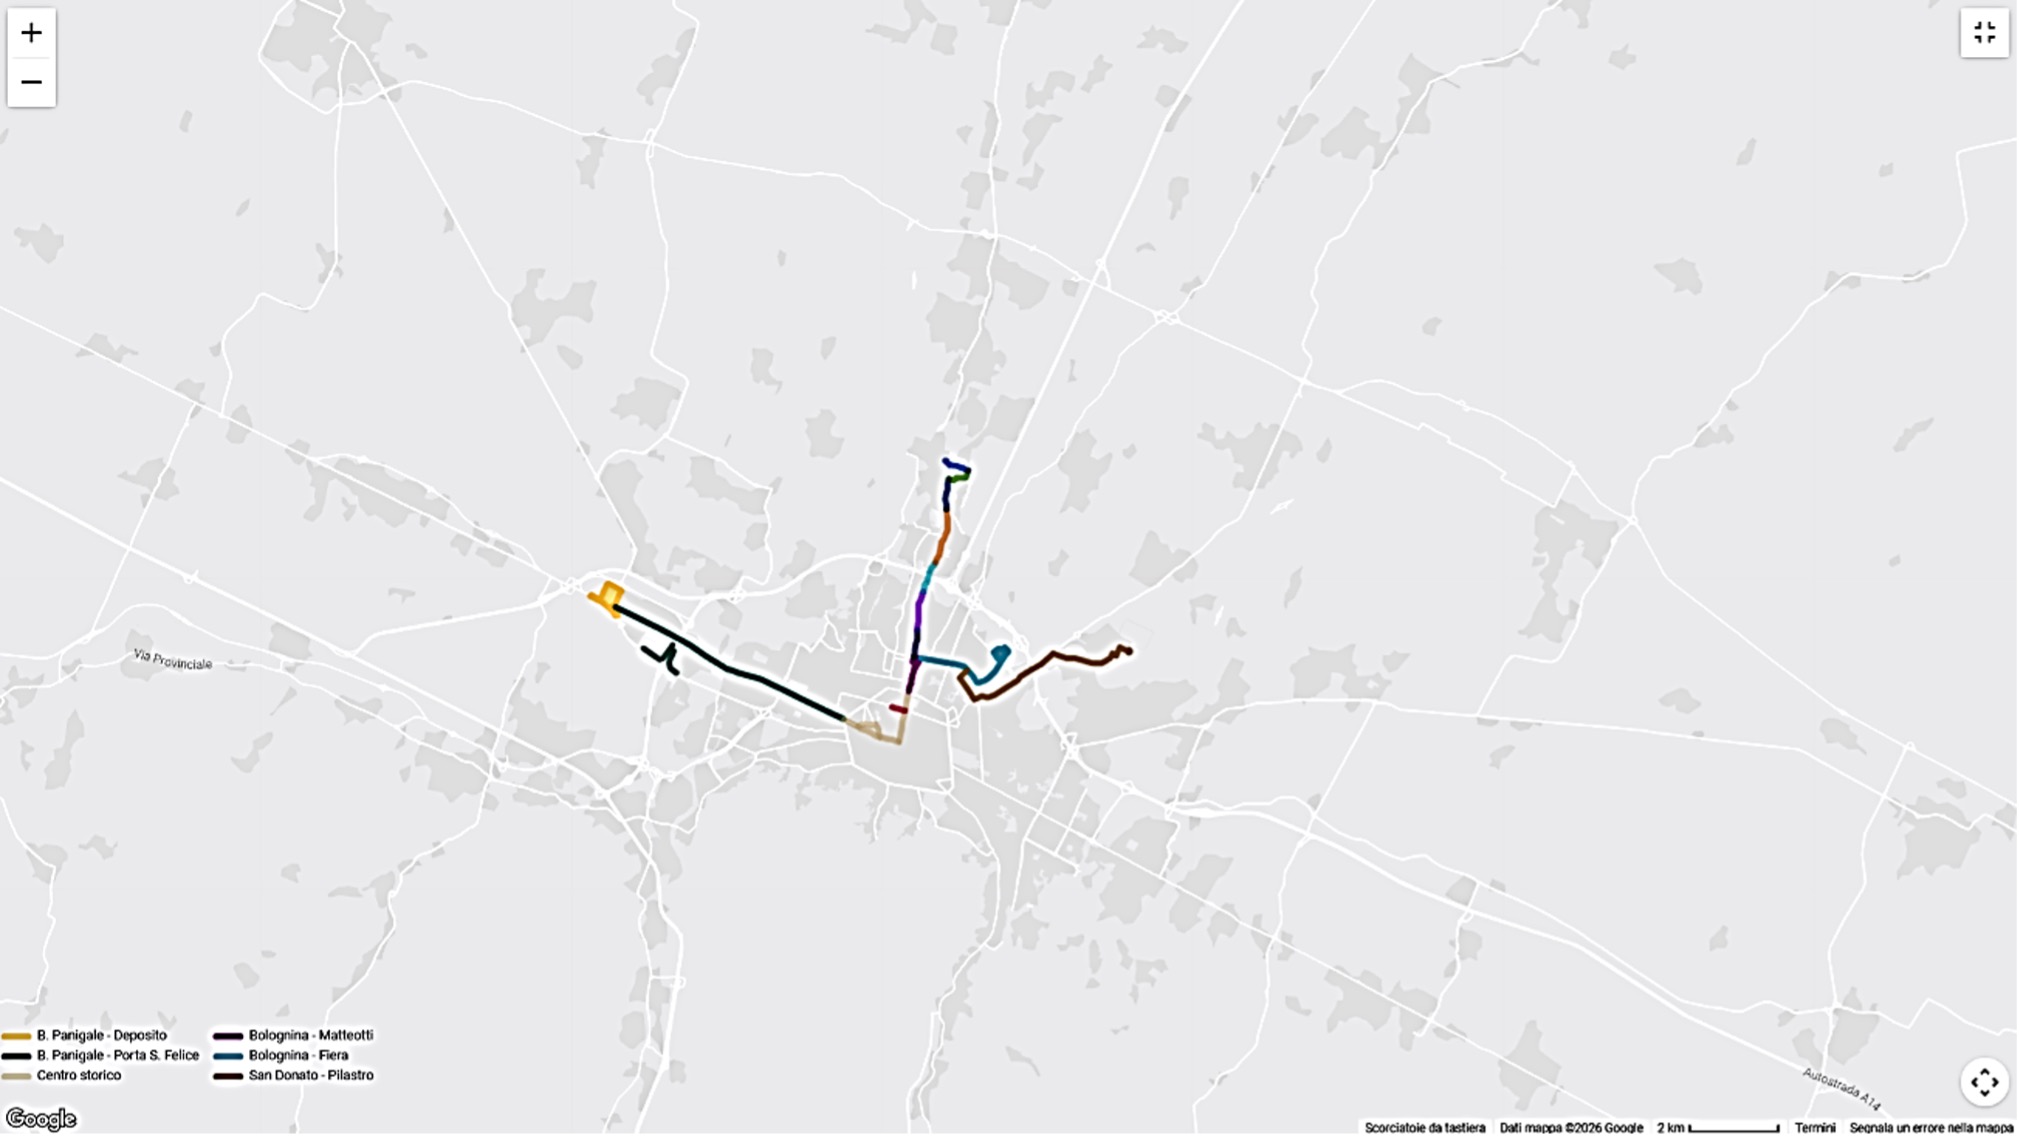
Figure 6 – Maps showing the construction sites for Bologna’s tram lines, available on the dedicated website
What if we were to isolate the ‘30 km/h zone’ effect?
To do this, we carried out a theoretical simulation: let’s imagine that all the vehicles in the sample are fitted with an on-board electronic speed limiter that ‘forces’ them to adhere to the speed limit. How long would it have taken them to complete the same journeys? By reducing the speed of the monitored journeys – that is, by assuming they maintained a speed of 30 km/h even when that limit had actually been exceeded on the real journey – we arrive at an interesting result. The increase in journey times, calculated based on journeys actually made in 2023, would be, in the worst-case scenario, around 5% longer than the actual recorded journey time: in absolute terms, for an average journey of less than 10 minutes, this amounts to just 24 seconds.
Calculation of the theoretical increase in journey times
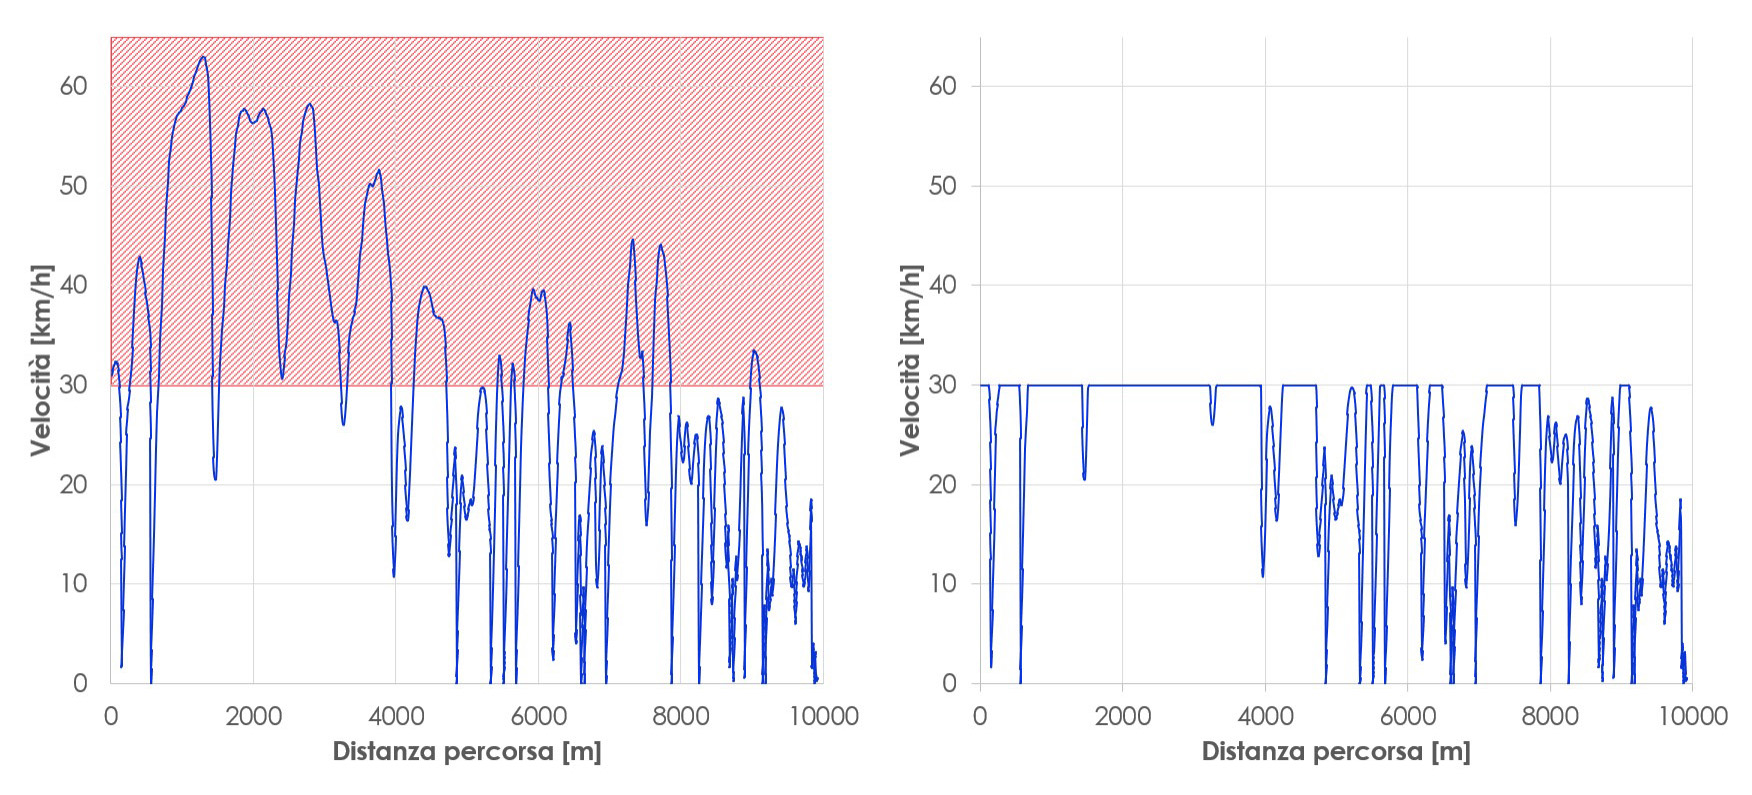
Figure 7 – Theoretical simulation using high-frequency FCD data
As expected, the increase in journey times would have been greater at night (up to around 10%), when vehicles tend to travel faster and the speed limit has a greater impact than the natural daytime slowdown caused by traffic. During rush hour, in fact, the increase falls below 4%: congestion already reduces speeds, acting as a ‘natural speed limiter’.
Is Bologna a more polluted city?
This is one of the questions to which the current study provides one of the most original and detailed answers offered to date.
According to estimates calculated using the GO-Mobility emissions model, emissions fall both in terms of climate-changing gases (CO₂, -14.6%) and in terms of air pollutants (CO, NOx and PM: -17.8%, -23.7% and -21.7% respectively). This is an apparently paradoxical result: the internal combustion engine is notoriously more efficient at 50 km/h than at 30 km/h in terms of fuel consumption per kilometre. How, then, can these reductions be explained?
The key lies in driving dynamics. The COPERT Tier 3 model, powered by high-frequency FCD data, allows emissions to be calculated not on the basis of average speed, but on the actual sequence of accelerations and decelerations. This is where the key lies: driving at 30 km/h in a more regular and consistent manner results in significantly fewer instances of abrupt stop-and-go, which are the most energy-intensive and highest-emission phases of the cycle.
Abrupt acceleration and sudden braking – which occur more frequently when driving at higher speeds in urban areas – cause spikes in fuel consumption that result in higher emissions. A significant reduction in these, as evidenced by real-world data, leads to an overall decrease in emissions: estimates based on the October sample show significant reductions in all pollutants between 2023 and 2024.
This remains true even if we assume that the vehicle fleet has not changed in terms of engine type between 2023 and 2024. If, on the other hand, we also take into account the renewal of the vehicle fleet, we see a further reduction: taking October 2023 as a baseline (‘index 100’), we estimate a reduction in CO₂ to 95.3% and in CO to 91.3%, whilst the decreases in NOx (82.6%) and PM (84%) are even more significant. This comparison highlights how, in terms of the quantitative reduction of polluting and climate-changing emissions, the effect of the ‘Città 30’ measure is comparable to (if not greater than) that resulting from the renewal of the vehicle fleet.
Emissions
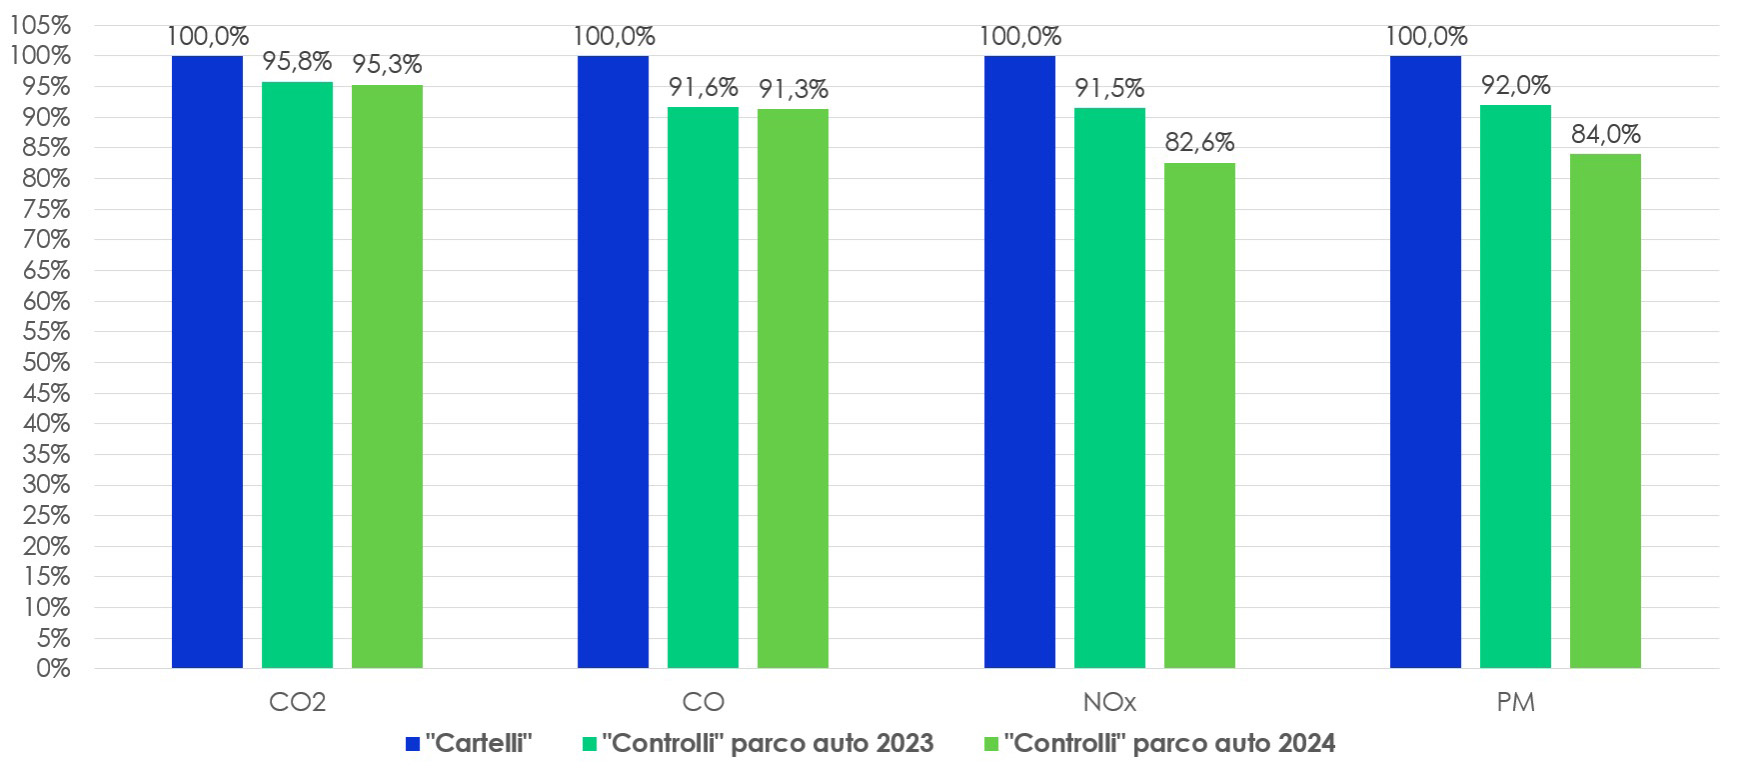
Figure 8 – Emissions scenarios – ‘100’ baseline, October 2023 (road signs only), projected changes in emissions using the same vehicle fleet as in 2023 and the same as in 2024. Estimates based on high-frequency FCD data
Are the streets of Bologna safer?
Data on road accidents, collected by the local police on roads within the municipal area of Bologna, confirm an overall decline in accidents and injuries in the period following the implementation of the measure, with the number of fatalities halved and no pedestrian fatalities recorded.
These figures also translate into savings in social costs arising from road accidents amounting to nearly €66 million for the Municipality of Bologna, according to a conservative estimate (i.e. one that assumes only moderate injuries) based on parameters from the Ministry of Transport and adjusted to the year 2025.
But even in this case, big data (aggregated FCD data) enables us to provide unprecedented insights derived from the analysis of Harsh and Crash events. Harsh events are instances of sudden changes in acceleration (braking, swerving, sudden acceleration) that can be precursors to accidents. Crash events are incidents that have actually resulted in a collision between vehicles, or between a vehicle and a generic obstacle (pole, tree, wall, etc.). The relationship between the two – that is, the probability that a Harsh event will lead to a Crash – is our risk indicator, i.e. the probability that a sudden change in acceleration (sharp steering or braking) will actually result in a road accident. What are the findings in this regard?
The probability that a sudden manoeuvre will result in a crash has fallen by 22.7% in 2024 and by 17.2% in 2025 compared with 2023. In fact, the proportion of sudden manoeuvres resulting in accidents has fallen from 11.56% in 2023 to 9.57% in 2025.
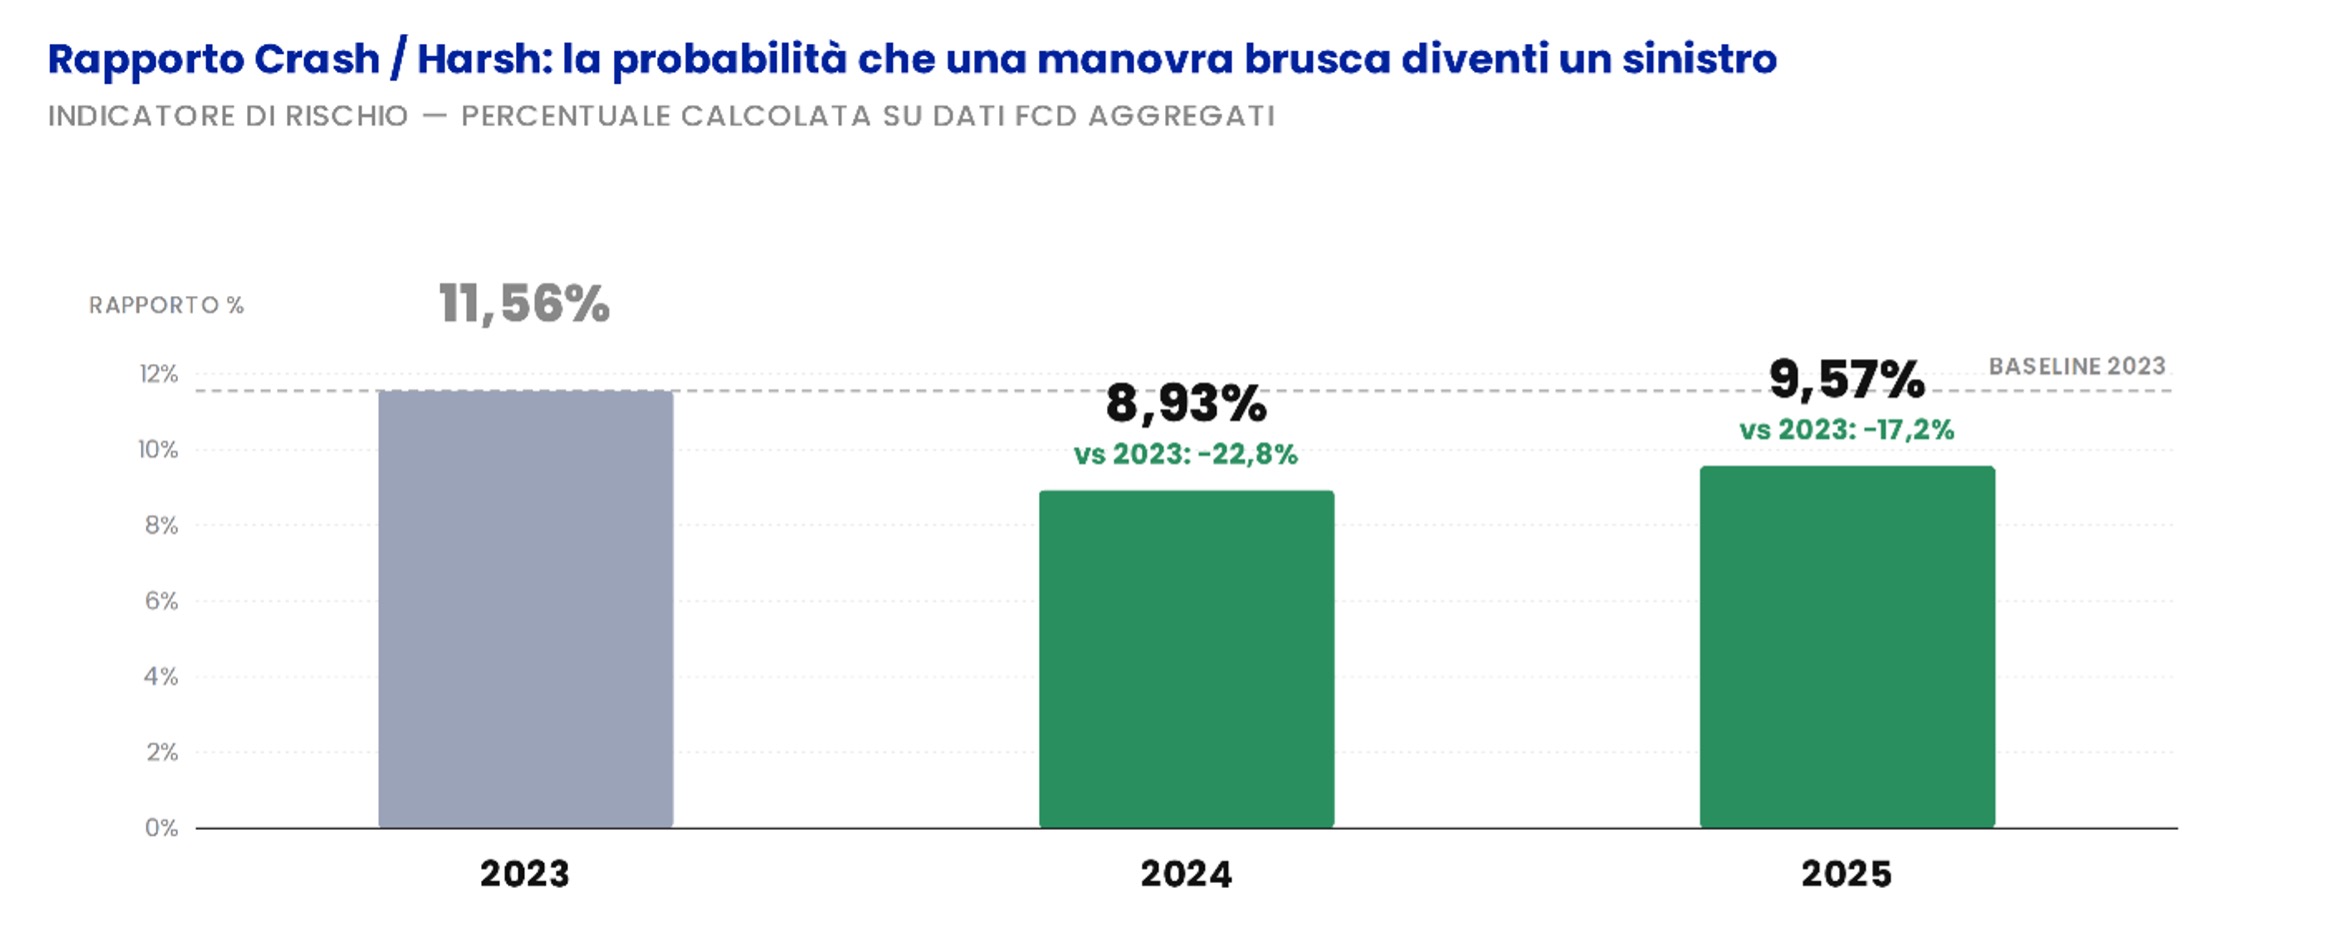
Figure 9 – Comparison of ‘Harsh’ and ‘Crash’ incidents recorded on the road network in Bologna during the first two quarters of 2024 and their respective percentage shares, based on aggregated FCD data.
Using the high-frequency FCD dataset (October 2023 vs October 2024), we carried out a similar analysis, paying particular attention to instances of sudden braking. The result is clear: the proportion of the most intense braking events (first percentile) decreases in intensity, falling from a deceleration of over −4.9 m/s² in 2023 to −2.8 m/s² in 2024: almost half the previous value. On 30 km/h roads, extreme braking events are halved (Figure 10). This demonstrates how enforcement has led to smoother driving behaviour and, consequently, to improved road safety in the city.
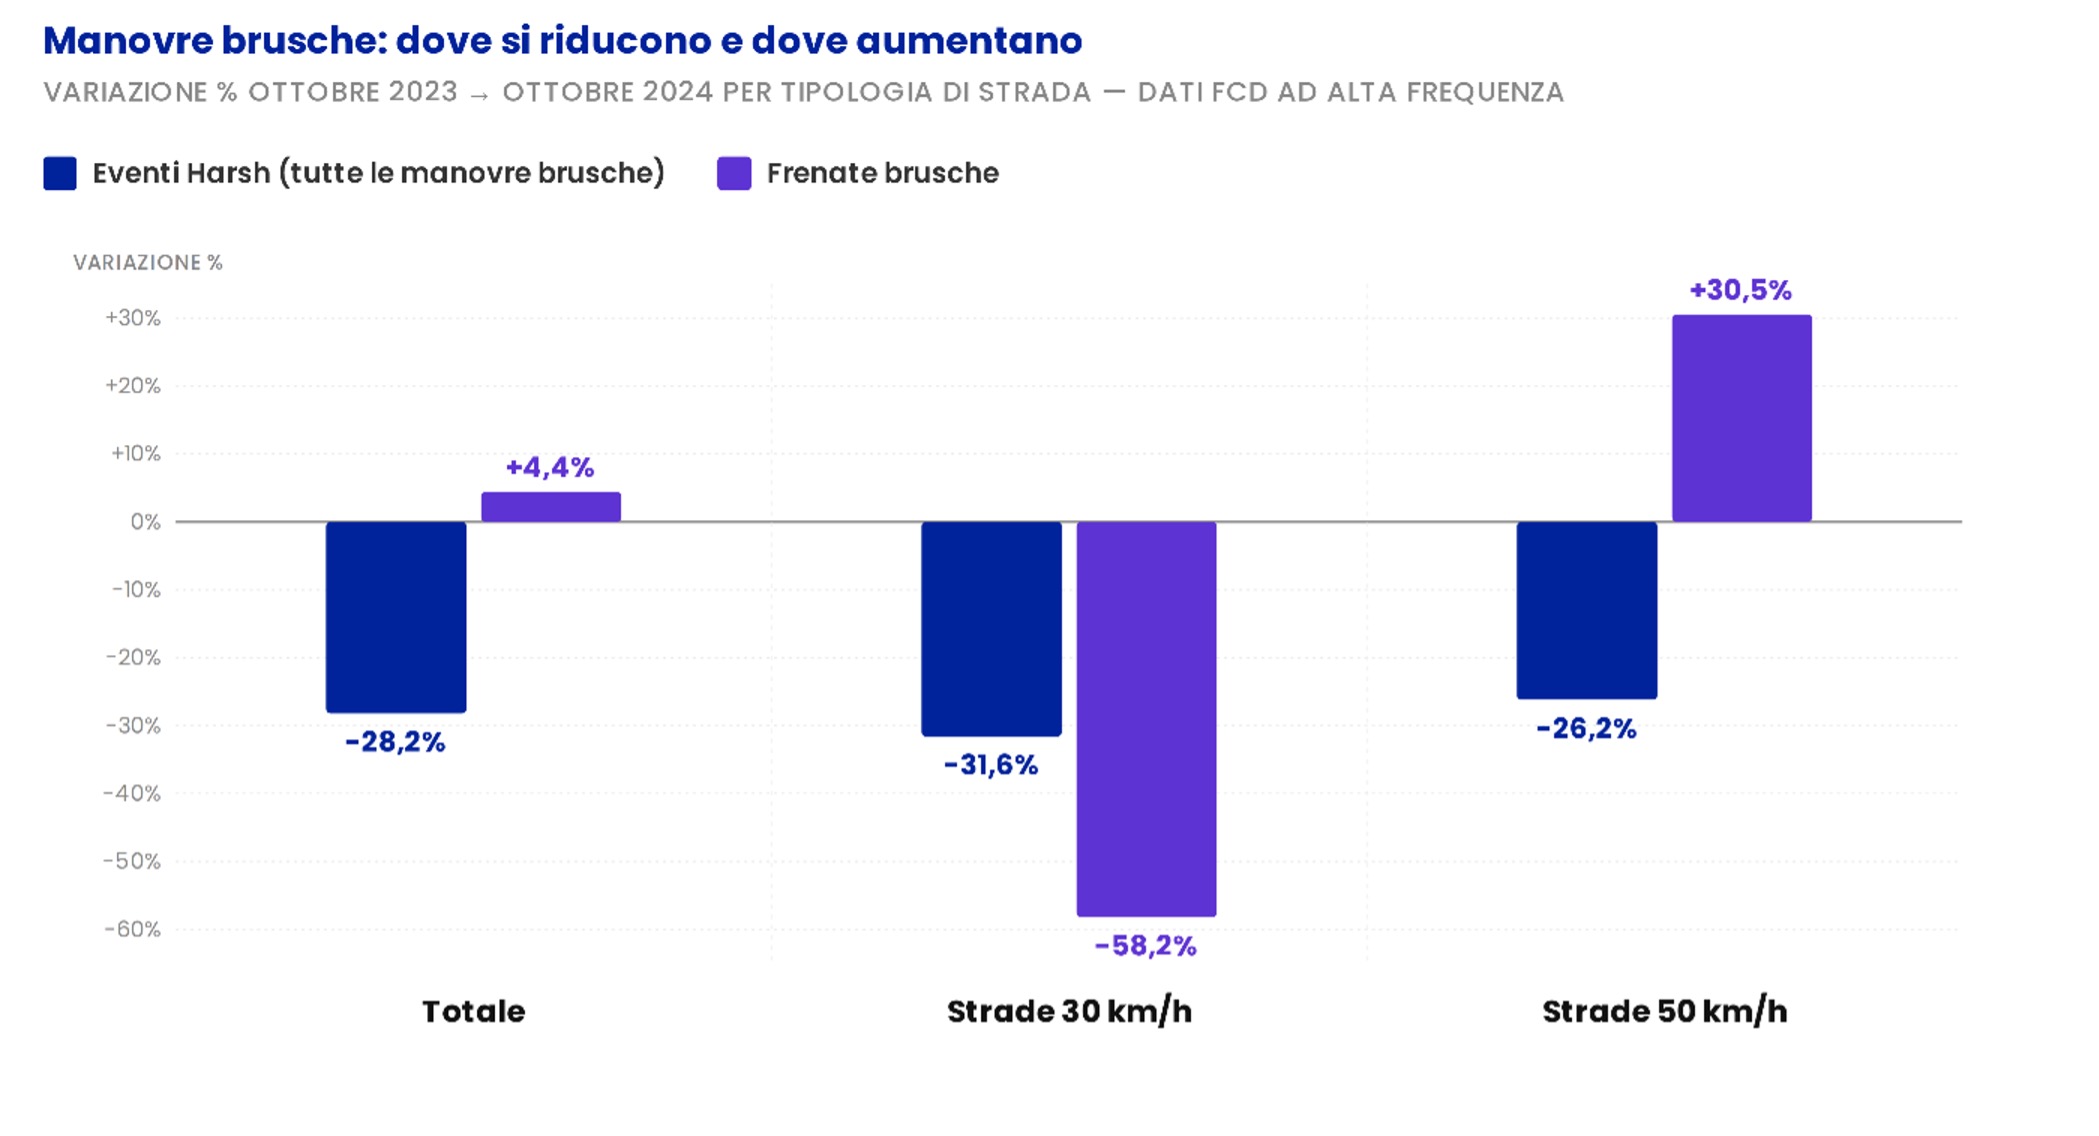
Figure 10 – Change in harsh events and sudden braking events between October 2023 and October 2024, based on high-frequency FCD data
The side effect
A closer look at the Harsh & Crash incidents raises further points for consideration. Whilst sudden braking decreases sharply on 30 km/h roads, it increases on 50 km/h roads (as shown in the previous graph, Figure 10). In October 2024, on roads outside the 30 km/h zone, there was a 30.5% increase in sudden braking compared to October 2023. This phenomenon can be interpreted as ‘road rage’: the frustration built up by driving at reduced speeds in the 30 km/h zones is released, once outside, in a more aggressive driving style.
Sudden braking and acceleration
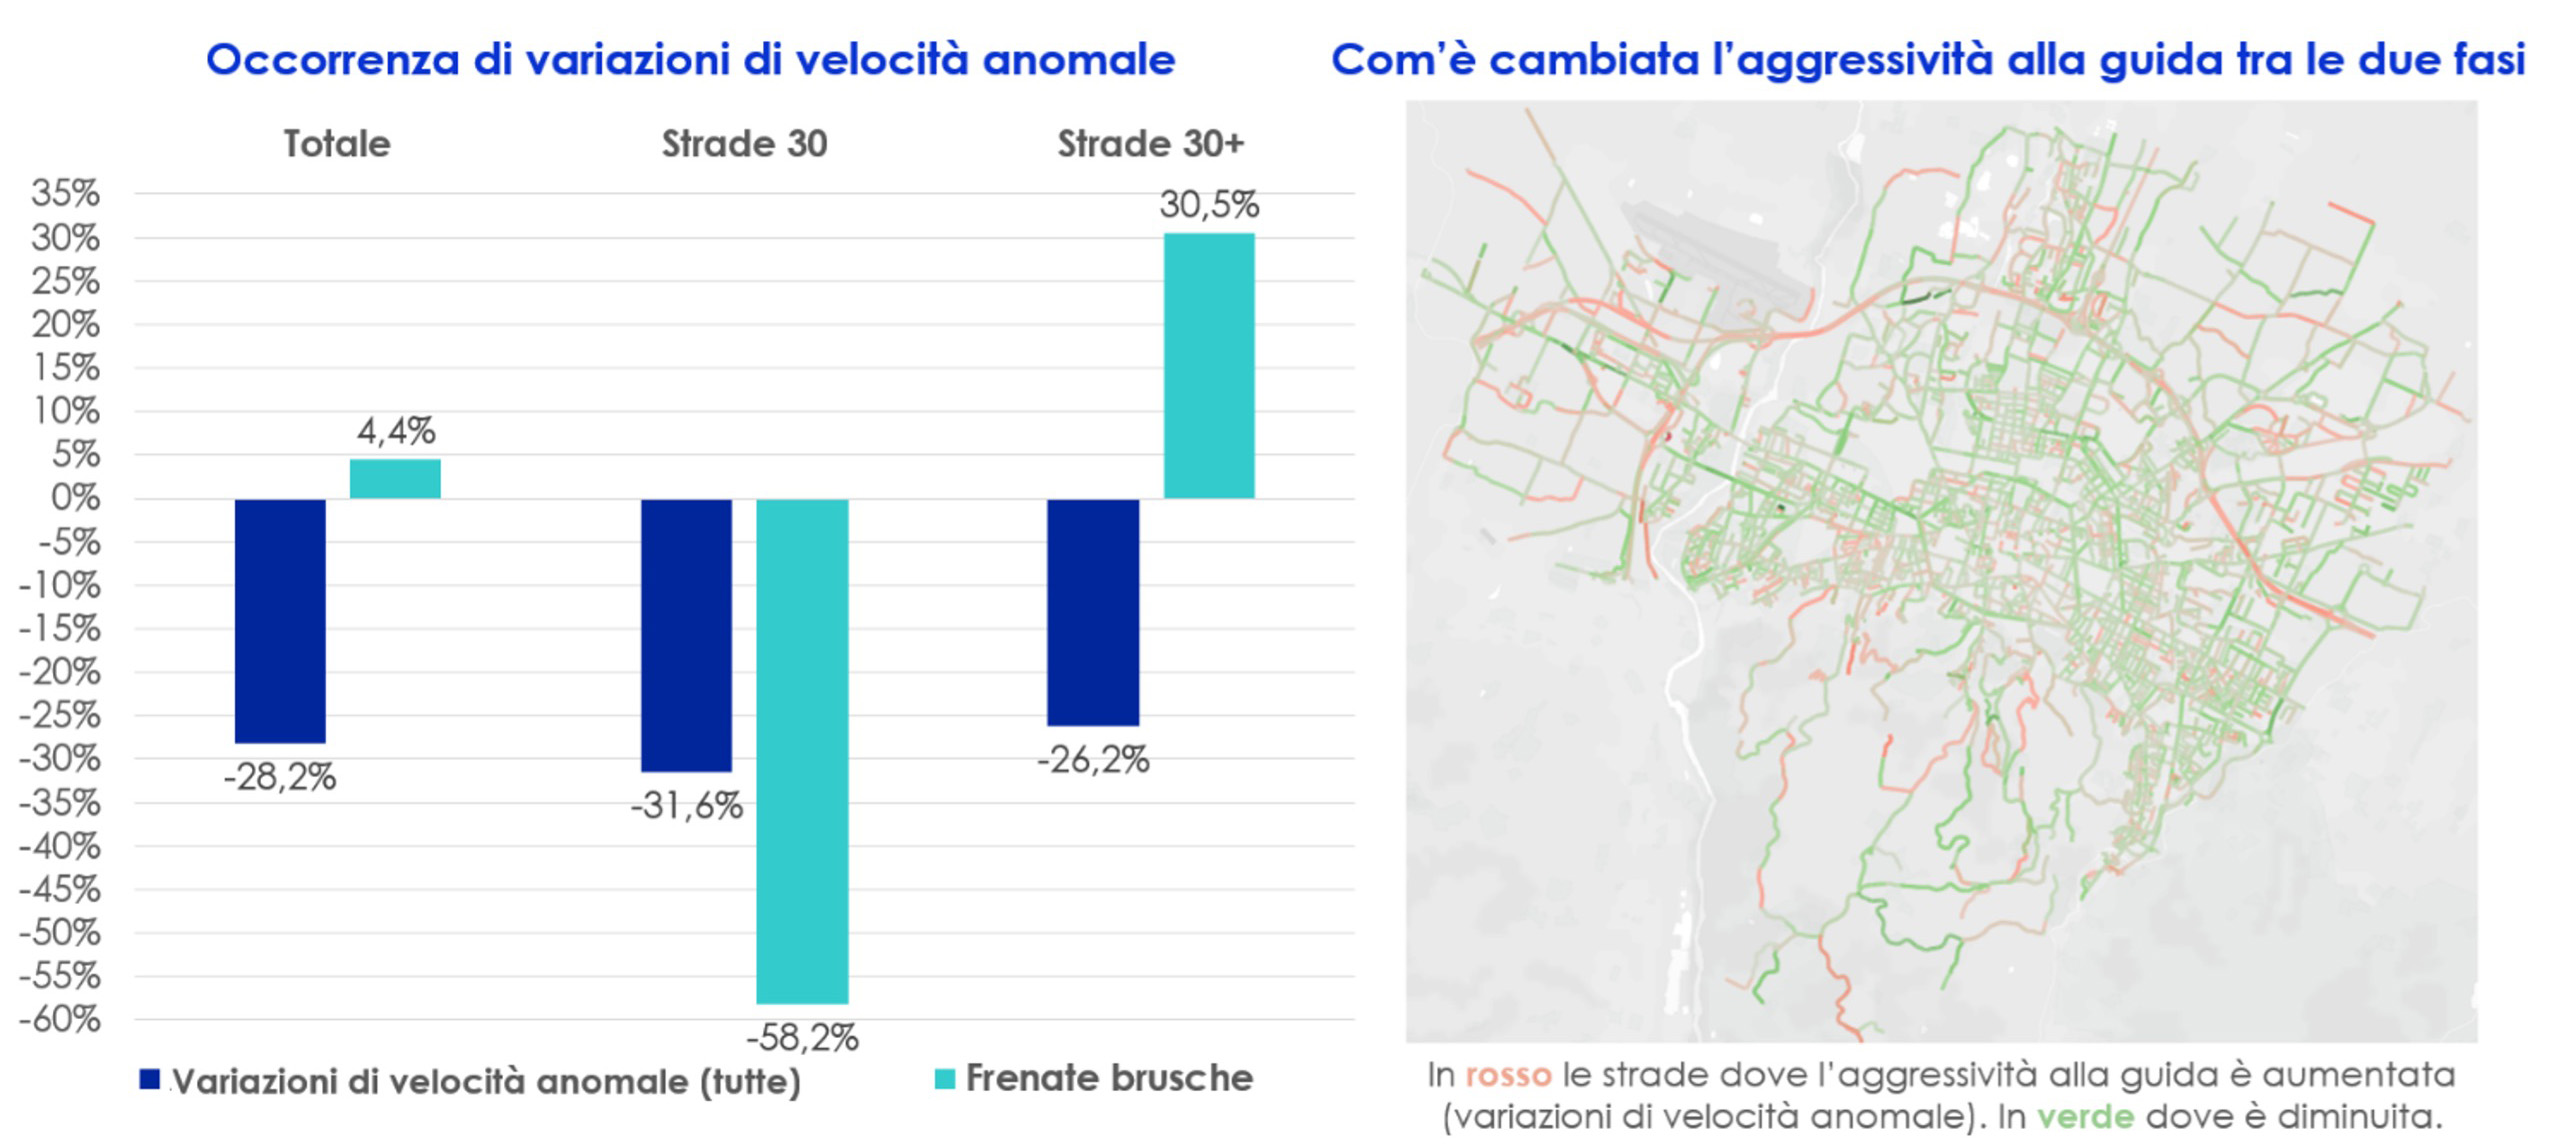
Figure 11 – Analyses from high-frequency FCDs
This is not an isolated phenomenon: similar evidence emerges from the literature on roadworks, where the perception of being forced to slow down increases frustration and, consequently, aggressive driving. According to certain psychological approaches (Theory of Planned Behaviour), the perception of an externally imposed control tends to generate resistance. Conversely, speed moderation achieved through physical road design (narrowings, chicanes, raised junctions) tends to produce more stable compliance (adherence to rules and limits) and less negative psychological reactivity.
This observation underscores the importance of infrastructure measures to support the ‘Città 30’ policy. By reducing frustrating factors (enforcement, perceived surveillance, lack of understanding of the speed limit), the sense of injustice and repression is diminished, and with it the likelihood of aggressive reactions[6].
Traffic: fewer cars on the road?
A large number of magnetic induction loops used for traffic counting are installed across the Bologna area throughout the year. Traffic counts for the first six months of 2024 and 2025 both show a reduction compared to 2023, although the decline is much more pronounced in 2025 (-16.3%, compared to -2.6% in 2024). This indicates that there has indeed been a modal shift in Bologna from private vehicles to other modes of transport (as confirmed by the increase in urban travel by train, bike and car sharing, and the number of bicycles in circulation), with an overall reduction in the number of private vehicles on the road. This trend is explained by a combination of the ‘Città 30’ scheme, the expansion of public transport, and the presence of construction sites linked to the tramway project, which have restricted traffic on certain routes.
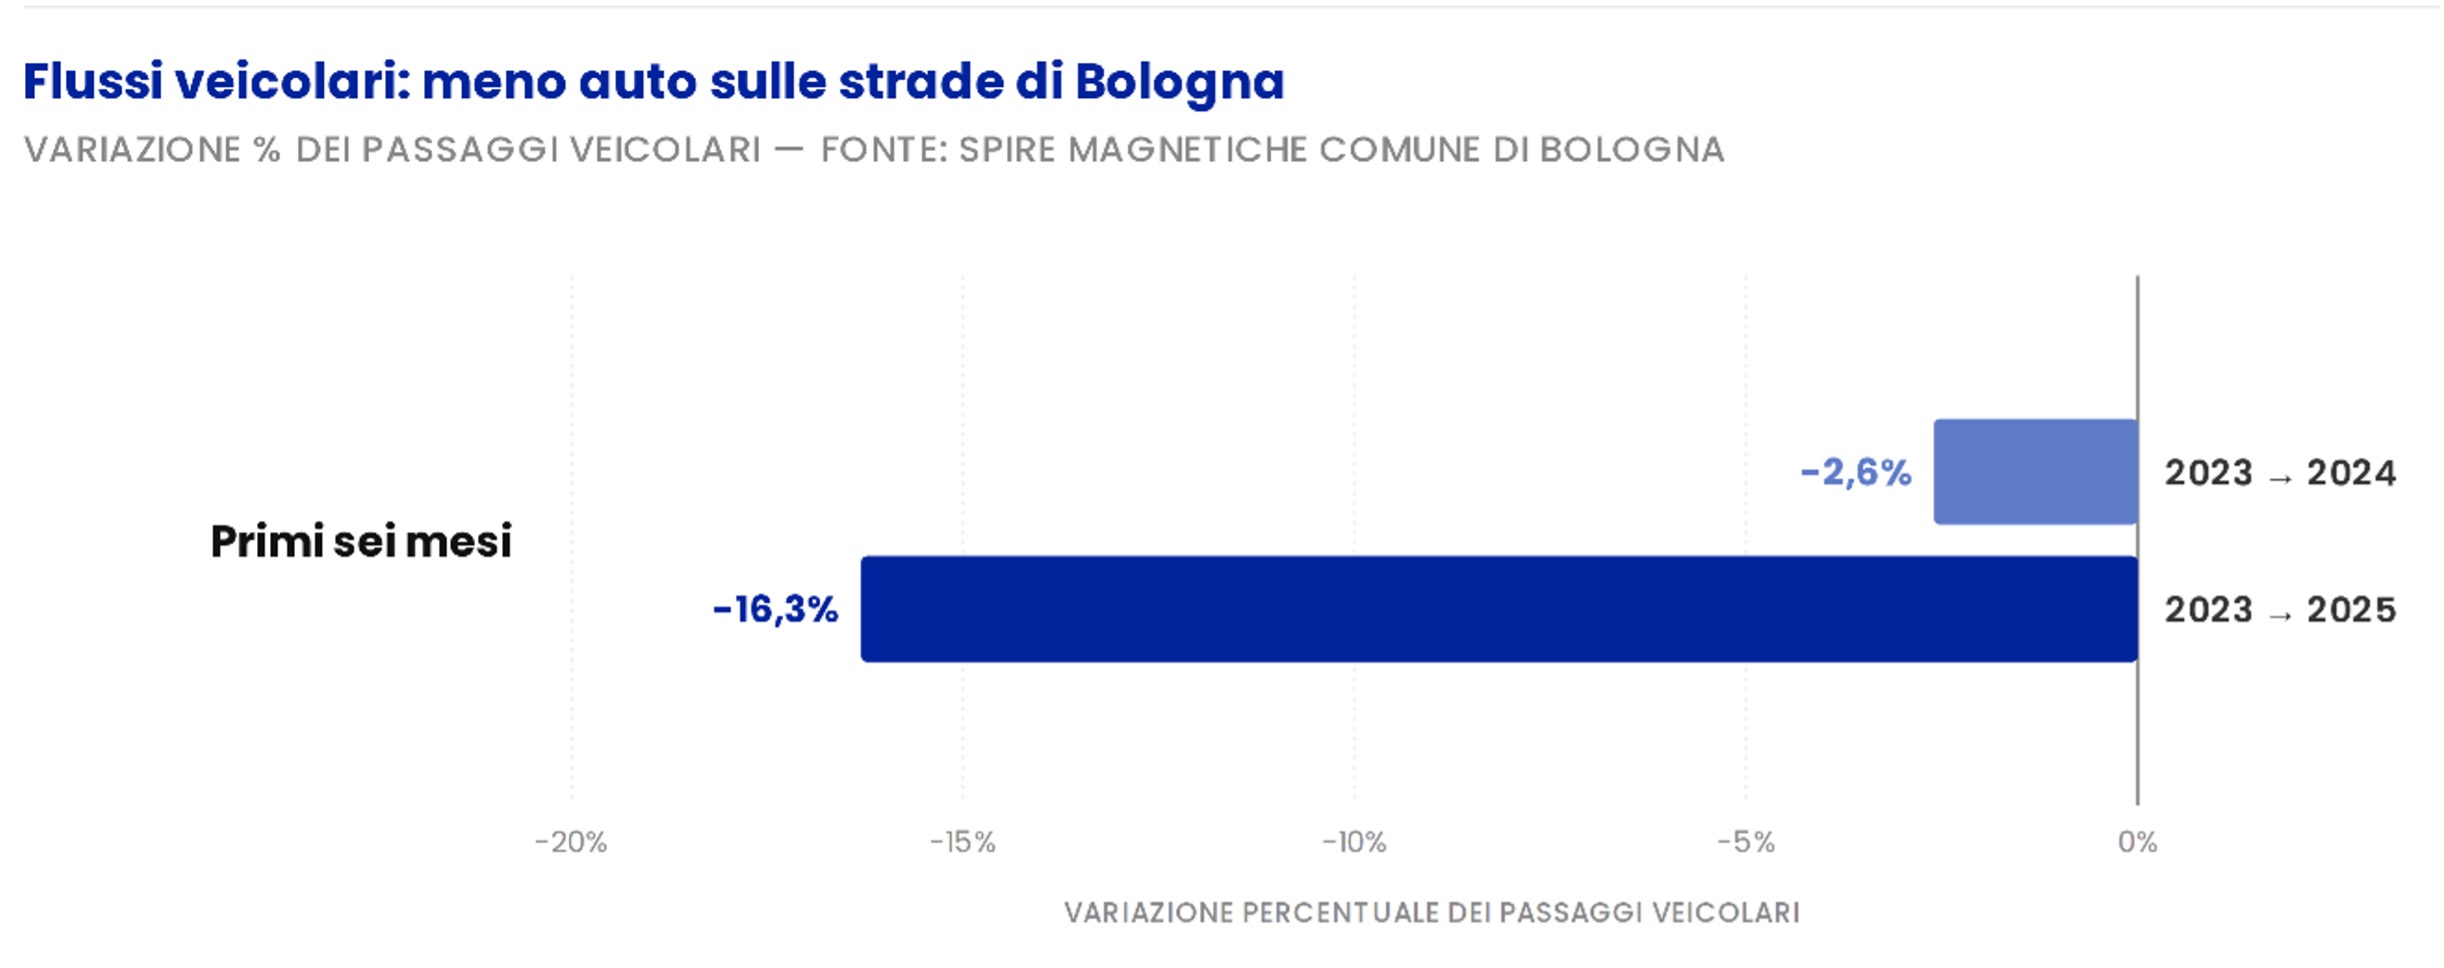
Figure 12 – Change in vehicle traffic recorded by the city of Bologna’s magnetic loops in the first two quarters of 2024 and 2025 compared with 2023
The figures for 30 km/h zones in Europe… do they resemble our own?
Bologna, of course, is not an isolated case: the ‘Città 30’ model is a widespread and well-established trend across Europe, allowing us to draw initial comparisons with similar cases.
Collisions are falling: in Amsterdam, after one year, car accidents on roads subject to the speed limit have fallen by 11%, and in London by 25%. A systematic review of 40 European cities[7] shows an average reduction of 23% in accidents, 37% in fatalities and 38% in injuries. Bologna fits into this picture: in the first year, there was a 13.1% reduction in accidents, a 48.7% reduction in fatalities and zero pedestrian deaths for the first time since 1991, whilst nationally, during the same period, deaths on urban roads rose by 7.9%. Furthermore, in Amsterdam, 63% of drivers comply with the new limit, comparable to the 58.4% compliance rate recorded by the FCD in Bologna.
The increase in journey times is marginal: this is the most common concern, and the data helps to put it into perspective. In Amsterdam, buses take an average of 40 seconds longer from terminus to terminus; in Wales, on the majority of routes monitored, journey times have increased by no more than two minutes. In Bologna, our theoretical simulation calculates an extra 24 seconds on an average journey of less than 10 minutes.
Contrary to popular belief, the heated and polarised debate against speed limit reductions is not unique to Italy: in Wales, the 20 mph limit sparked street protests, the toppling of road signs and a petition with nearly half a million signatures. Two years later, there have been 630 fewer accidents (more than a third) and the implementation cost (around £40 million) was recouped in the first year alone thanks to savings on the social costs associated with accidents (such as the £66 million in savings calculated by the City of Bologna).
Nor is the side effect on fast roads an isolated case: in Wales, on roads with speed limits of 40 mph and above, collisions have risen slightly (+4%, compared with a fall of -26% on roads subject to the limit), comparable to the sort of ‘road rage’ that has seen a rise in more aggressive driving outside the ‘Città 30’ zone in Bologna.
The final verdict
After two years of collecting data on actual journeys, we are now able to present an assessment of Bologna Città 30 that addresses the three key themes of this initiative:
- Journey times between 2023 and 2025 have increased slightly, but the smallest increases are seen on the typical routes taken by the average city user, amounting to an extra 14 seconds per kilometre: for an average journey of 5.2 km, this equates to an increase of just over a minute. On roads where the speed limit has been reduced to 30 km/h, the increase is 24 seconds per km, whilst the greatest changes are seen on roads where the speed limit remains at 50 km/h (+28 s/km) and on the urban road network as a whole (+26 s/km), confirming that journey times, in the actual dynamics of city traffic, are influenced far more by factors other than the maximum speed limit (roadworks, traffic lights at junctions, traffic congestion, etc.). Thanks to the theoretical simulation, it was possible to deduce that the 30 km/h limit, on its own, would add a maximum of 24 seconds to an average 10-minute journey: a marginal impact, especially during peak hours when congestion already acts as the main limiting factor.
- Environment: contrary to popular belief, driving at a reduced but constant speed reduces emissions of all major pollutants by between 15% and 24%. The reduction in consumption peaks resulting from smoother, more consistent driving (fewer sudden stops and starts) more than compensates for the engine’s lower thermal efficiency at low speeds and produces a reduction in emissions comparable to that achieved by renewing the vehicle fleet.
- Safety: sudden braking has more than halved on 30 km/h roads (-58.2% in 2024 compared to 2023), and overall, in the first year, the likelihood of a sudden acceleration (‘harsh’ event) leading to a collision (‘crash’) (stabilising at -17.2% in 2025 compared to 2023) – confirming that a lower speed limit encourages a smoother and safer driving style.
One issue remains unresolved: the ‘rebound effect’ on roads outside the 30 km/h zone, where aggressive driving has increased. This is a sign that regulatory measures alone are not enough, and that physical speed reduction through traffic-calming measures on the infrastructure – already initiated by the City Council with its €35 million programme – is the factor that will determine the measure’s effectiveness and long-term sustainability.
Notes
The data for this analysis are taken from the Bologna Città 30 Monitoring Report, drawn up in December 2025 by GO-Mobility on behalf of the Rusconi Ghigi Urban Innovation Foundation.
[1] Updates on the inspections carried out each year can be found in the relevant section of the Bolognacittà30 website.
[2] The roads were identified using a methodology set out in the Plan to implement the Directive issued by the Minister of Transport on 1 February 2024, and on the basis of a detailed technical analysis which is summarised in a specific technical data sheet for each individual road or section of road attached to the orders, in accordance with the Highway Code and in compliance with the Regional Administrative Court’s ruling of last January.
[3] In Emilia-Romagna, the sampling rate for this type of vehicle, as monitored by the data providers used, is 3%. However, the number of journeys monitored is sufficient to ensure that the observed phenomena are well represented.
[4] Mellios, G., Ntziachristos, L., Papageorgiou, T. (2024), COPERT 5.8.1 – Road Transport Emission Inventory Model, EMISIA
[5] EMEP/EEA, Air Pollutant Emission Inventory Guidebook 2025 – Road Transport (1.A.3.b)
[6] To explore the link between frustration at the wheel and aggression: Deffenbacher, J. L., Lynch, R. S., Filetti, L. B., Dahlen, E. R., & Oetting, E. R. (2003). “Anger, aggression, risky behavior, and crash-related outcomes in three groups of drivers”, Behaviour Research and Therapy, 41, 333–349.
[7] Yannis G., Michelaraki E. (2024), Review of City-Wide 30 km/h Speed Limit Benefits in Europe, Sustainability, 16(11), 4382. https://www.mdpi.com/2071-1050/16/11/4382
Sign up for our newsletter!
Every month, you’ll receive news, articles and content hand-picked for you by our editorial team.
Data Mobility is a project by GO-Mobility
Find out more about us and the projects through which we turn data into mobility solutions.
©2026 GO-Mobility s.r.l. | VAT Number 11257581006